Average monthly rainy days in Balestrand

The number of days each month with rain, snow and hail in Balestrand (Sogn og Fjordane), Norway.

Average monthly rainy days in Balestrand,

Feel free to add this climate graph to your website. Click the copy button above.

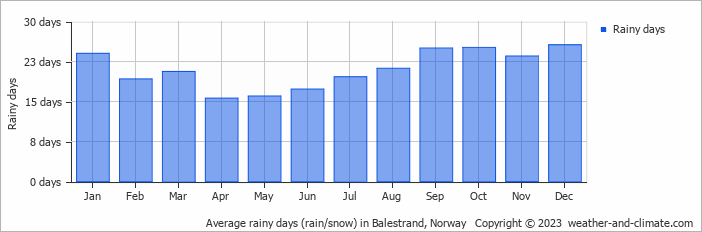
  • Most rainy days are in January, February, March, April, May, June, July, August, September, October, November and December.
  • On average, December is the most rainy with 25 days of rain/snow.
  • On average, April is the driest month with 15 rainy days.
  • The average annual number of rainy days is 252.

Weather Forecasts for Balestrand

Thu   Mar 28
10°C | 5°C
E 14 km/h
1.9 mm
overcast and  chance of slight rain

overcast and chance of slight rain

Fri   Mar 29
10°C | 3°C
E 14 km/h
1.9 mm
partly cloudy and slight rain

partly cloudy and slight rain

Sat   Mar 30
8°C | 1°C
NE 11 km/h
0.1 mm
broken clouds and small chance of slight rain

broken clouds and small chance of slight rain

Interested in more climate information?

Weather and Climate provides you with all the information you need about the climate in Balestrand.

Our site offers climate and forecast data for every country in the world. Are you going to Norway? On this website you can find historical weather averages for many cities in Norway. Not sure yet where to go? We now have a tool which recommends destinations that suit your ideal climate conditions. Find out where to go with our weather planner.