Average monthly rainy days in Bairiki
The number of days each month with rain, snow and hail in Bairiki (), Kiribati.
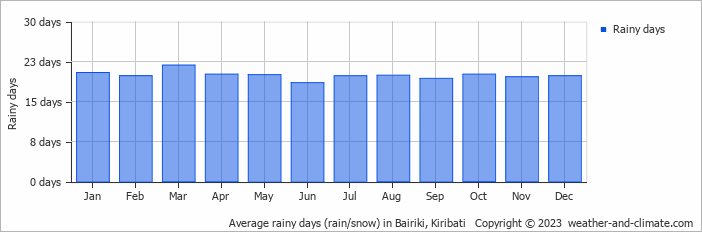
- Most rainy days are in January, February, March, April, May, June, July, August, September, October, November and December.
- On average, March is the most rainy with 21 days of rain/snow.
- On average, June is the driest month with 18 rainy days.
- The average annual number of rainy days is 238.
Weather Forecasts for Bairiki
Sun Apr 28
31°C | 27°C
E  29 km/h
29 km/h1.3 mm
partly cloudy and rain
Mon Apr 29
32°C | 27°C
NE 22 km/h
22 km/h6.5 mm
partly cloudy and chance of slight rain
Tue Apr 30
32°C | 27°C
E 22 km/h
22 km/h7.2 mm
partly cloudy and rain


