Monthly Average Rainy days in Wonder Valley (CA)
The number of days each month with rain, snow and hail in Wonder Valley (California), the United States of America.
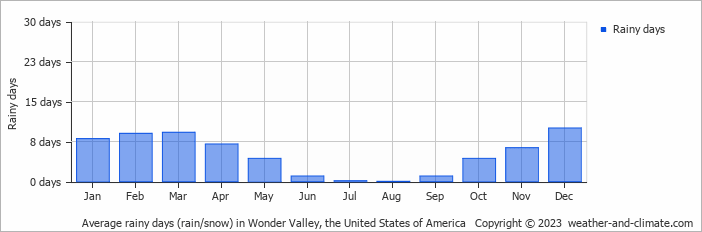
- Wonder Valley has dry periods in June, July, August and September.
- On average, December is the most rainy with 10 days of rain/snow.
- On average, August is the driest month with 0 rainy days.
- The average annual number of rainy days is 60.
Current rainfall in Wonder Valley (CA)
Sat Nov 23
16°C | 9°C
E  7 km/h
7 km/h19 mm
broken clouds and rain
Sun Nov 24
16°C | 7°C
S 7 km/h
7 km/halmost clear and no rain
Mon Nov 25
16°C | 8°C
NE 11 km/h
11 km/h36 mm
overcast and heavy rain


