Monthly Average Rainy days in Wallowa Lake (OR)
The number of days each month with rain, snow and hail in Wallowa Lake (Oregon), the United States of America.
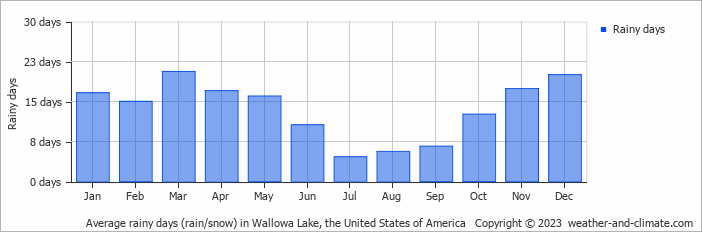
- Most rainy days are in January, February, March, April, May, November and December.
- On average, March is the most rainy with 20 days of rain/snow.
- On average, July is the driest month with 4 rainy days.
- The average annual number of rainy days is 162.
Current rainfall in Wallowa Lake (OR)
Sun Dec 22
5°C | 0°C
S  3 m/s
3 m/s
3 m/s4.3 mm
overcast and slight sleet
Mon Dec 23
4°C | -1°C
S 3 m/s
3 m/s5.6 mm
almost clear and rain
Tue Dec 24
3°C | -6°C
NW 3 m/s
3 m/s28 mm
overcast and heavy sleet


