Monthly Average Rainy days in Playa La Saladita
The number of days each month with rain, snow and hail in Playa La Saladita (Guerrero), Mexico.
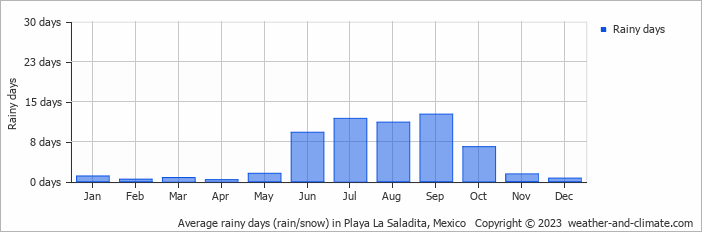
- Playa La Saladita has dry periods in January, February, March, April, May, November and December.
- On average, September is the most rainy with 12 days of rain/snow.
- On average, April is the driest month with 0 rainy days.
- The average annual number of rainy days is 57.
Current rainfall in Playa La Saladita
Sat Jan 11
27°C | 21°C
SW  4 m/s
4 m/s
4 m/s6.1 mm
partly cloudy and thunder
Sun Jan 12
28°C | 20°C
NW 4 m/s
4 m/s9.2 mm
partly cloudy and thunder
Mon Jan 13
30°C | 20°C
SW 3 m/s
3 m/spartly cloudy and no rain


