Monthly Average Rainy days in Narvik
The number of days each month with rain, snow and hail in Narvik (Nordland), Norway.
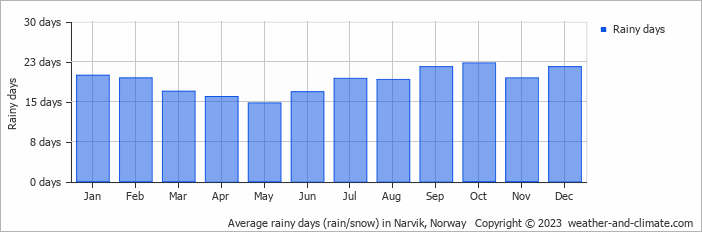
- Most rainy days are in January, February, March, April, June, July, August, September, October, November and December.
- On average, October is the most rainy with 22 days of rain/snow.
- On average, May is the driest month with 14 rainy days.
- The average annual number of rainy days is 226.
Current rainfall in Narvik
Tue Jan 28
-1°C | -6°C
NE  3 m/s
3 m/s
3 m/s1.6 mm
overcast and chance of slight snow
Wed Jan 29
-1°C | -9°C
E 3 m/s
3 m/spartly cloudy and no rain
Thu Jan 30
-7°C | -10°C
E 3 m/s
3 m/sovercast and no rain