Average monthly rainy days in Mount Pleasant

The number of days each month with rain, snow and hail in Mount Pleasant (), Falkland Islands (Malvinas).

Average monthly rainy days in Mount Pleasant,

Feel free to add this climate graph to your website. Click the copy button above.

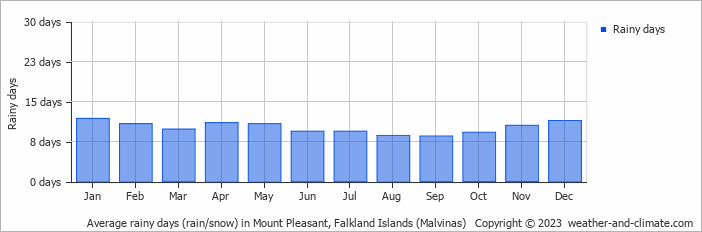
  • On average, January is the most rainy with 11 days of rain/snow.
  • On average, September is the driest month with 8 rainy days.
  • The average annual number of rainy days is 121.

Weather Forecasts for Mount Pleasant

Thu   Mar 28
15°C | 5°C
NW 47 km/h
1.6 mm
broken clouds and small chance of rain

broken clouds and small chance of rain

Fri   Mar 29
12°C | 3°C
W 47 km/h
0.9 mm
partly cloudy and slight rain

partly cloudy and slight rain

Sat   Mar 30
7°C | 2°C
SW 40 km/h
2.4 mm
broken clouds and rain

broken clouds and rain

Interested in more climate information?

Weather and Climate provides you with all the information you need about the climate in Mount Pleasant.

Our site offers climate and forecast data for every country in the world. Are you going to Falkland Islands (Malvinas)? On this website you can find historical weather averages for many cities in Falkland Islands (Malvinas). Not sure yet where to go? We now have a tool which recommends destinations that suit your ideal climate conditions. Find out where to go with our weather planner.