Monthly Average Rainy days in Lopez Island
The number of days each month with rain, snow and hail in Lopez Island (), the United States of America.
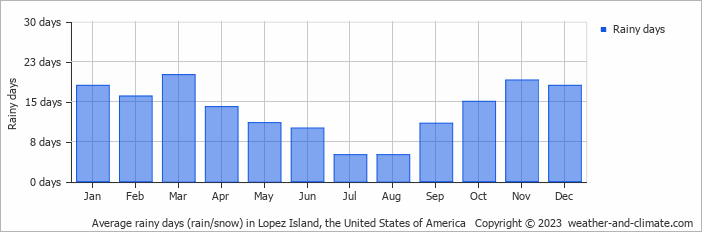
- Most rainy days are in January, February, March, October, November and December.
- On average, March is the most rainy with 20 days of rain/snow.
- On average, August is the driest month with 5 rainy days.
- The average annual number of rainy days is 161.
Current rainfall in Lopez Island
Fri Dec 27
10°C | 6°C
SE  5 m/s
5 m/s
5 m/s5.5 mm
overcast and rain
Sat Dec 28
11°C | 8°C
SW 8 m/s
8 m/s3.2 mm
broken clouds and rain
Sun Dec 29
9°C | 7°C
SW 7 m/s
7 m/s6.3 mm
broken clouds and rain


