Monthly Average Rainy days in Kuching
The number of days each month with rain, snow and hail in Kuching (Sarawak), Malaysia.
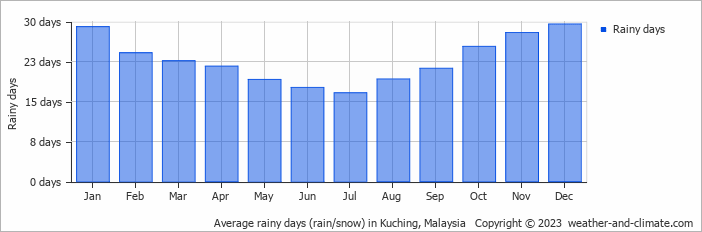
- Most rainy days are in January, February, March, April, May, June, July, August, September, October, November and December.
- On average, December is the most rainy with 29 days of rain/snow.
- On average, July is the driest month with 16 rainy days.
- The average annual number of rainy days is 273.
Current rainfall in Kuching
Sun Nov 03
31°C | 24°C
NW  11 km/h
11 km/h9.9 mm
broken clouds and thunder
Mon Nov 04
32°C | 24°C
NW 7 km/h
7 km/h5.4 mm
broken clouds and thunder
Tue Nov 05
34°C | 24°C
NW 7 km/h
7 km/h17 mm
broken clouds and thunder