Monthly Average Rainy days in Komakuk Beach
The number of days each month with rain, snow and hail in Komakuk Beach (), Canada.
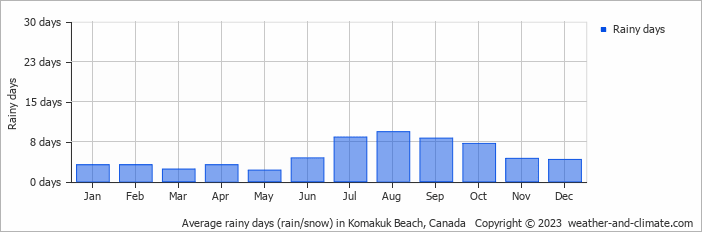
- On average, August is the most rainy with 9 days of rain/snow.
- On average, May is the driest month with 2 rainy days.
- The average annual number of rainy days is 59.
Current rainfall in Komakuk Beach
Tue Jan 14
-1°C | -11°C
W  10 m/s
10 m/s1.1 mm
broken clouds and small chance of slight snow
Wed Jan 15
-9°C | -14°C
W 12 m/s
12 m/s8.6 mm
overcast and small chance of snow
Thu Jan 16
-14°C | -23°C
S 6 m/s
6 m/s2.5 mm
partly cloudy and small chance of slight snow