Monthly Average Rainy days in Gili Islands
The number of days each month with rain, snow and hail in Gili Islands (Bali), Indonesia.
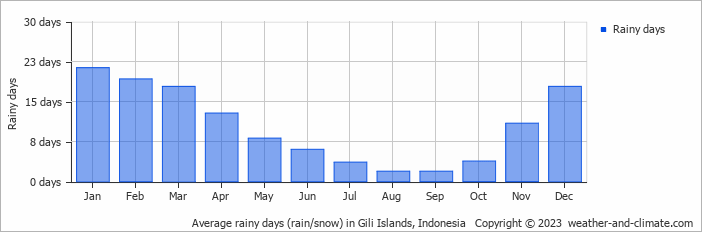
- Most rainy days are in January, February, March and December.
- Gili Islands has dry periods in August and September.
- On average, January is the most rainy with 21 days of rain/snow.
- On average, August is the driest month with 1 rainy day.
- The average annual number of rainy days is 125.
Current rainfall in Gili Islands
Wed Jan 15
30°C | 24°C
N  4 m/s
4 m/s
4 m/s6.1 mm
partly cloudy and rain
Thu Jan 16
30°C | 25°C
N 3 m/s
3 m/s4.7 mm
broken clouds and thunder
Fri Jan 17
29°C | 24°C
N 3 m/s
3 m/s21 mm
broken clouds and thunder


