ClimateForecastMayJune >>

Average monthly rainy days in Cagliari

The number of days each month with rain, snow and hail in Cagliari (Sardinia), Sardinia.

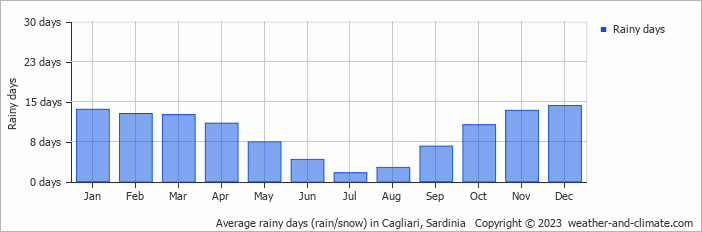
  • On average, December is the most rainy with 14 days of rain/snow.
  • On average, July is the driest month with 1 rainy day.
  • The average annual number of rainy days is 109.

Forecast for Cagliari

Mon   May 06
22°C | 15°C
SE 22 km/h
partly cloudy and no rain

partly cloudy and no rain

Tue   May 07
24°C | 14°C
NW 22 km/h
1.1 mm
partly cloudy and  chance of rain

partly cloudy and chance of rain

Wed   May 08
22°C | 11°C
NW 18 km/h
0.8 mm
partly cloudy and  chance of rain

partly cloudy and chance of rain

Interested in more climate information?

This site provides you with all the information you need about the climate in Cagliari.

Our site offers climate and forecast data for every country in the world. Are you going to Sardinia? On this website you can find historical weather averages for many cities in Sardinia. Not sure yet where to go? We now have a tool which recommends destinations that suit your ideal climate conditions. Find out where to go with our weather planner.