Average monthly rainy days in Batouri

The number of days each month with rain, snow and hail in Batouri (), Cameroon.

Average monthly rainy days in Batouri,

Feel free to add this climate graph to your website. Click the copy button above.

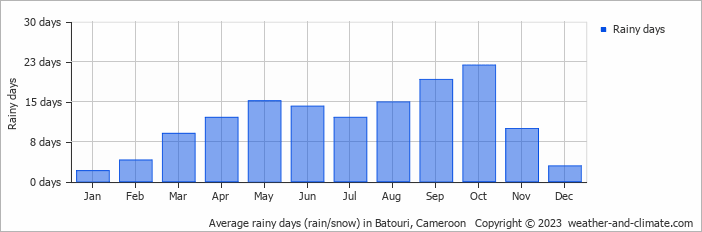
  • Most rainy days are in May, September and October.
  • On average, October is the most rainy with 21 days of rain/snow.
  • On average, January is the driest month with 2 rainy days.
  • The average annual number of rainy days is 136.

Weather Forecasts for Batouri

Tue   Mar 19
34°C | 21°C
N 7 km/h
2 mm
broken clouds and thunder

broken clouds and thunder

Wed   Mar 20
30°C | 22°C
SE 7 km/h
3.7 mm
broken clouds and thunder

broken clouds and thunder

Thu   Mar 21
32°C | 22°C
W 7 km/h
3.3 mm
broken clouds and small chance of rain

broken clouds and small chance of rain

Interested in more climate information?

Weather and Climate provides you with all the information you need about the climate in Batouri.

Our site offers climate and forecast data for every country in the world. Are you going to Cameroon? On this website you can find historical weather averages for many cities in Cameroon. Not sure yet where to go? We now have a tool which recommends destinations that suit your ideal climate conditions. Find out where to go with our weather planner.