Wexford Weather and Climate: A Comprehensive Guide
Temperatures see a moderate degree of fluctuation,
transitioning from pleasant conditions
to cold.
It also has a notably wet climate with much precipitation.
Let's now guide you through the climate details for a complete overview.
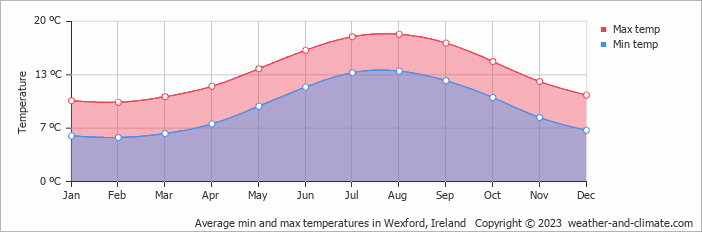
Average maximum day and minimum night temperature
In Wexford, seasonal changes bring about a moderate variation in temperatures. Average maximum daytime temperatures range from a pleasant 18°C in August, the warmest time of the year, to a chilly 10°C during cooler months like February.
At night, temperatures typically drop to an average of around 6°C during these months.Check out our detailed temperature page for more information.
Temperature ranges by month
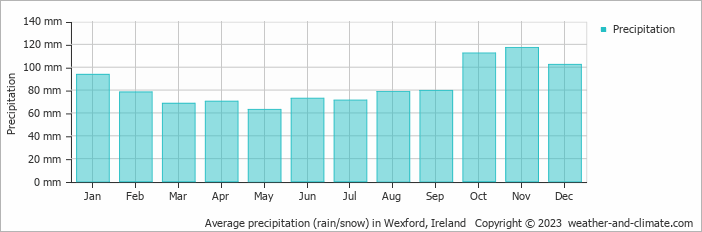
Precipitation and rainy days
Wexford is known for its substantial rainfall, with annual precipitation reaching 1007 mm. While rainfall varies throughout the year, each season offers its own charm. November brings wetter days averaging 117 mm of precipitation, spread over 17 rainy days.
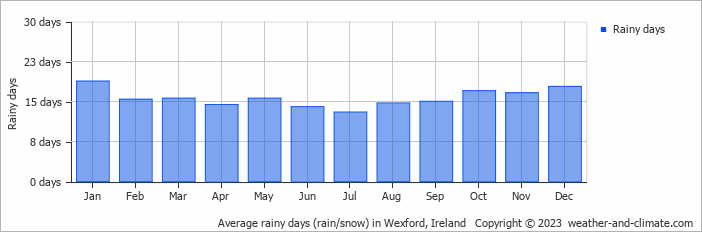
In contrast, May experiences a drier climate, with about 63 mm of rainfall spread across 16 rainy days.The mean monthly precipitation over the year, including rain, hail and snow
The average number of days each month with precipitation
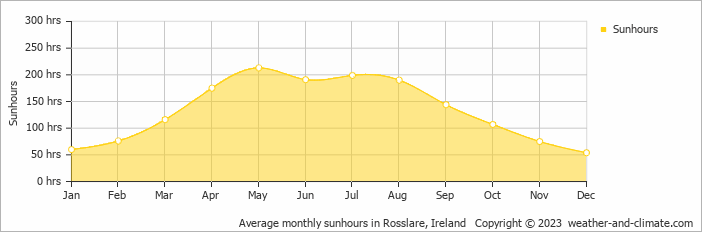
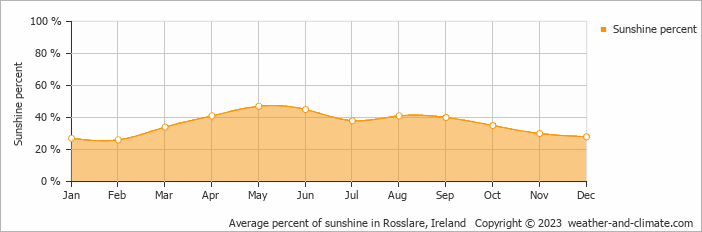
Sunshine over the year
Seasonal changes in sunshine hours are quite dramatic in Wexford. While May receives considerable daily sunshine with up to 7.1 hours, December marks the darkest time of the year, where sunshine is scarce with only 1.8 hours of sunlight per day.
Visit our detailed sunshine hours page for more information.
Monthly hours of sunshine
Daily hours of sunshine
Daily percentage of sunshine
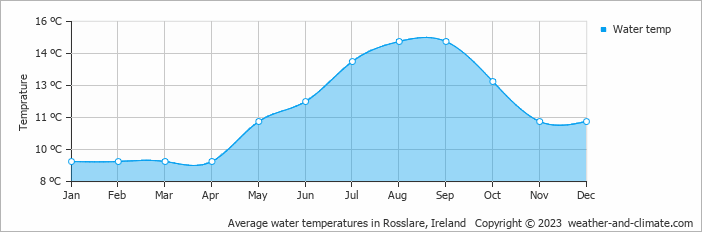
Average water temperature
The mean water temperature over the year ranges from 9°C in January to 15°C in August.
Water temperature over the year
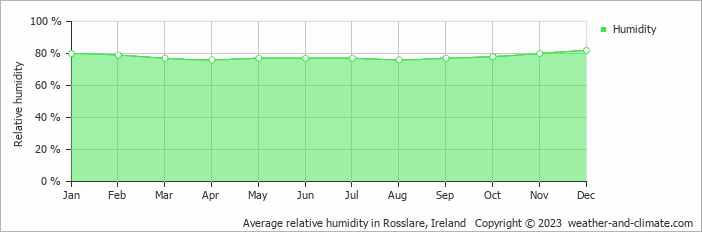
Average humidity
The relative humidity is high throughout the year in Wexford.
The city experiences its highest humidity in December, reaching 82%. In April, the humidity drops to its lowest level at 76%. What does this mean? Read our detailed page on humidity levels for further details.
Relative humidity over the year
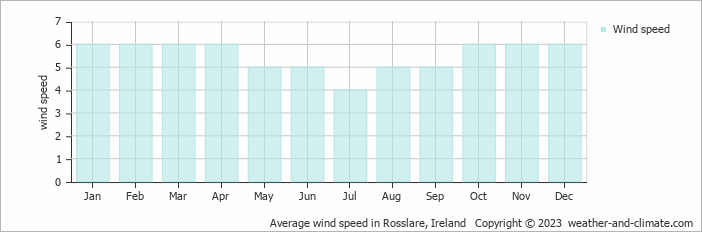
Average wind speed
The average wind speed over the year ranges from 4 m/s to 6 m/s. It is lower in July and higher in January, February, March, April, October, November and December.
The mean monthly wind speed over the year (meters per second)
Forecast for Wexford


Select a Month of Interest
Check the conditions for any month of the year.
The best time of year to visit Wexford in Ireland
Other facts from our historical weather data:August has an average maximum temperature of 18°C and is the warmest month of the year.
The coldest month is February with an average maximum temperature of 10°C.
November tops the wettest month list with 117 mm of rainfall.
May is the driest month with 63 mm of precipitation.
May is the sunniest month with an average of 213 hours of sunshine.
No idea where to travel to this year? We have a tool that recommends destinations based on your ideal conditions. Find out where to go with our weather planner.