Key Largo (FL) Weather and Climate: A Comprehensive Guide
Temperatures in Key Largo experience a moderate degree of variance through the seasons.
Days can be very warm, while the cooler months tend
to be warm.
It is also known for its large amounts of rainfall.
Now, let’s explore all the climate details to give you a full picture.
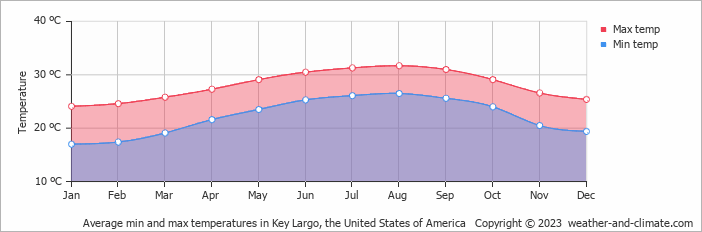
Average maximum day and minimum night temperature
The climate in Key Largo experiences moderate temperature changes, with mild shifts between seasons. Typically, average maximum daytime temperatures range from a very warm 32°C in August to a comfortable 24°C in the coolest month, January.
Nights are cooler, with lows often dropping to around 17°C during the colder months.Check out our detailed temperature page for more information.
Temperature ranges by month
Precipitation and rainy days
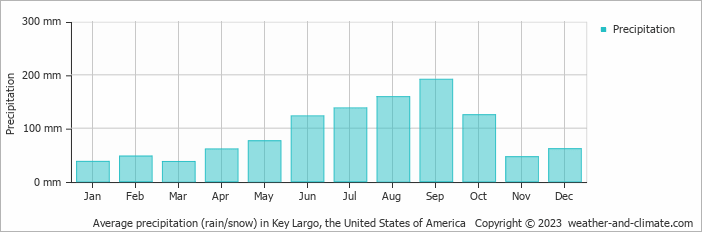
Key Largo has a notably wet climate with abundant precipitation, recording 1102 mm of rainfall per year. The climate in Key Largo shows significant variation throughout the year. Expect heavy rainfall in September, with an average of 191 mm of precipitation over 22 rainy days.
In contrast, March offers drier and sunnier days, with around 37 mm of rainfall over 8 rainy days. For more details, please visit our Key Largo Precipitation page.The mean monthly precipitation over the year, including rain, hail and snow
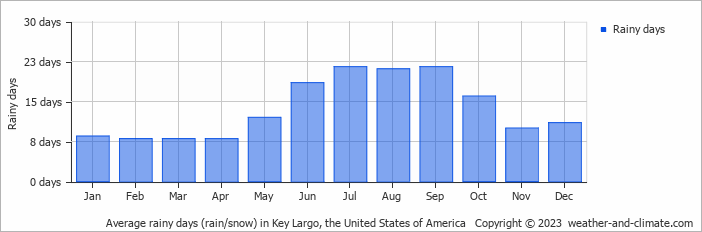
The average number of days each month with precipitation
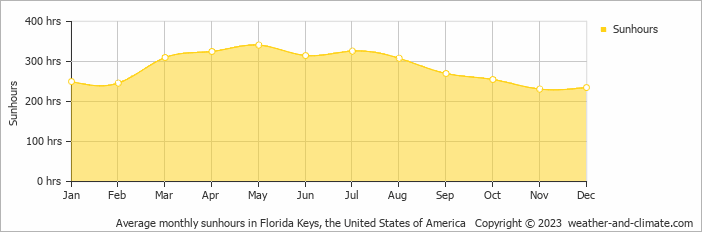
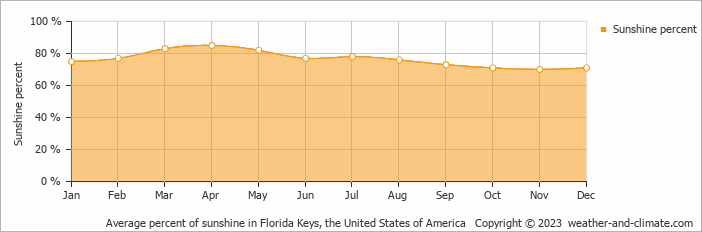
Sunshine over the year
Key Largo offers a pleasant mix of sunny and slightly overcast days. The difference in sunshine hours between May (11.4 hours daily) and November (7.7 hours daily) provides a bit of variety for visitors and residents.
Visit our detailed sunshine hours page for more information.
Monthly hours of sunshine
Daily hours of sunshine
Daily percentage of sunshine
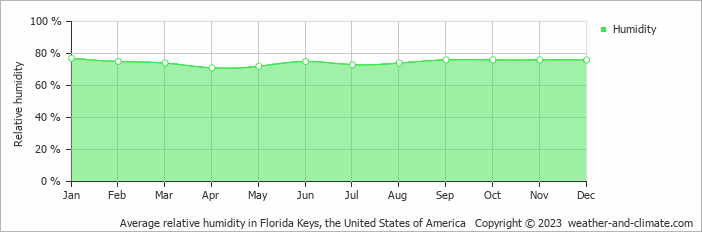
Average humidity
The relative humidity is high throughout the year in Key Largo.
The city experiences its highest humidity in January, reaching 77%. In April, the humidity drops to its lowest level at 71%. What does this mean? Read our detailed page on humidity levels for further details.
Relative humidity over the year
Forecast for Key Largo (FL)


Select a Month of Interest
Check the conditions for any month of the year.
The best time of year to visit Key Largo in the United States of America
During the months of January, February, March and December you are most likely to experience good weather with pleasant average temperatures that fall between 20°C and 26°C.Other facts from our historical weather data:
Most rainfall (rainy season) is seen in August and September.
August has an average maximum temperature of 32°C and is the warmest month of the year.
The coldest month is January with an average maximum temperature of 24°C.
September tops the wettest month list with 191 mm of rainfall.
March is the driest month with 37 mm of precipitation.
May is the sunniest month with an average of 341 hours of sunshine.
No idea where to travel to this year? We have a tool that recommends destinations based on your ideal conditions. Find out where to go with our weather planner.


