Reykjavík Weather and Climate: A Comprehensive Guide
Reykjavik experiences a cool maritime climate with relatively mild winters and fairly cool summers. During winter the temperature is around freezing during the day and at night it freezes lightly. Under influence of the warm ocean water it can also stay above freezing during some days in winter. Sometimes the temperature can drop during the night to freezing temperature of around -20°C or even lower.
On an annual basis Reykjavik has around 1300 hours of sun, 800 mm of precipitation and 150 precipitation days.
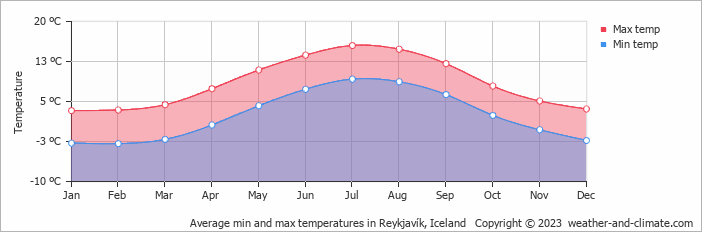
Average maximum day and minimum night temperature
The climate in Reykjavík is known for significant temperature differences throughout the year, making the weather dynamic. On average, daytime temperatures range from a moderate 16°C in July to a chilly 3°C in February.
Nighttime temperatures can drop, with average lows reaching -3°C in February.Check out our detailed temperature page for more information.
Temperature ranges by month
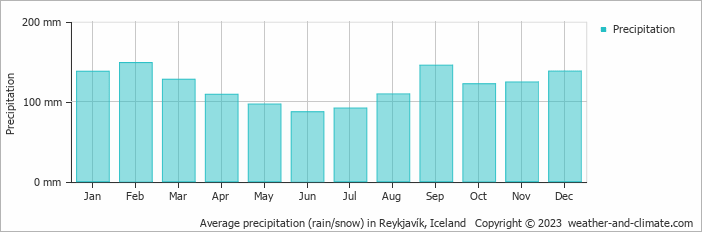
Precipitation and rainy days
Reykjavík has a notably wet climate with abundant precipitation, recording 1436 mm of rain/snowfall per year. The amount of precipitation varies moderately throughout the year. The wettest month, February, sees around 148 mm of snow/rainfall, perfect for those who enjoy a bit of snow/rain now and then. The driest month, June, still receives a respectable 87 mm of rainfall.
The mean monthly precipitation over the year, including rain, hail and snow
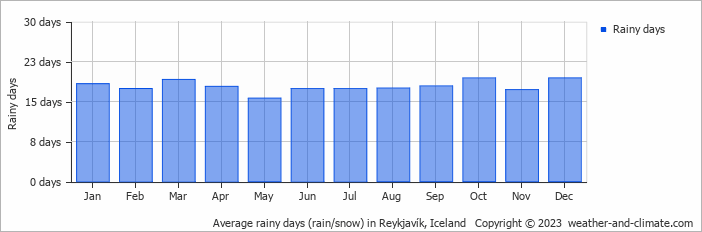
The average number of days each month with precipitation
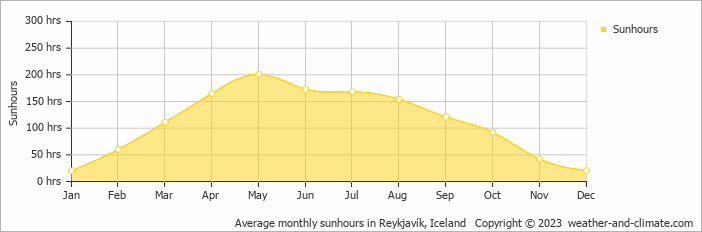
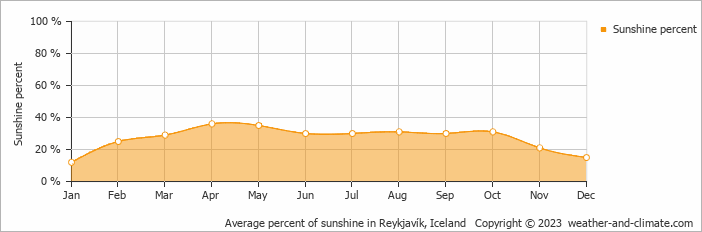
Sunshine over the year
In Reykjavík, summer days are longer and more sunny, with daily sunshine hours peaking at 6.7 hours in May. As the darker season arrives, the brightness of the sun becomes less. January sees a soft sun for only 0.7 hours per average day.
Visit our detailed sunshine hours page for more information.
Monthly hours of sunshine
Daily hours of sunshine
Daily percentage of sunshine
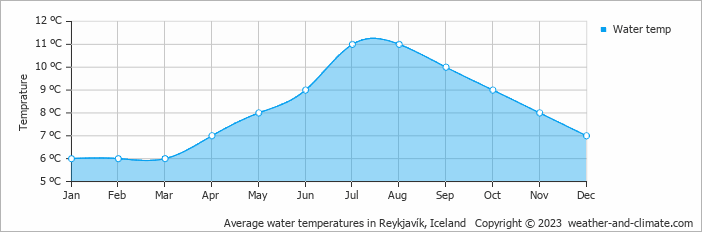
Average water temperature
The mean water temperature over the year ranges from 6°C in January to 11°C in July.
Water temperature over the year
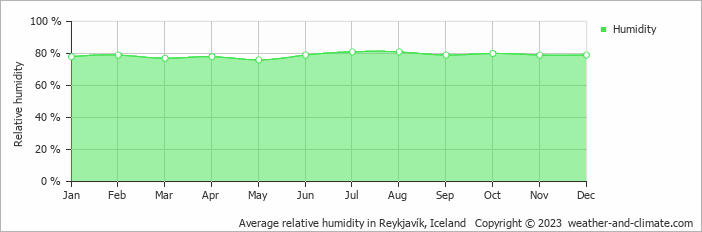
Average humidity
The relative humidity is high throughout the year in Reykjavík.
The city experiences its highest humidity in July, reaching 81%. In May, the humidity drops to its lowest level at 76%. What does this mean? Read our detailed page on humidity levels for further details.
Relative humidity over the year
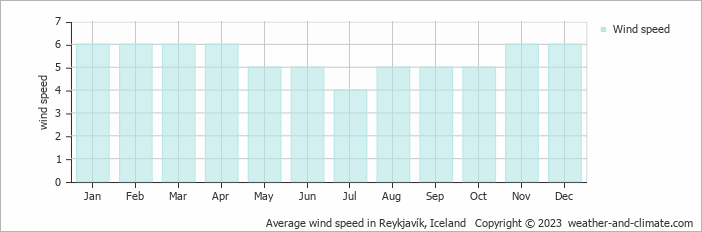
Average wind speed
The average wind speed over the year ranges from 4 m/s to 6 m/s. It is lower in July and higher in January, February, March, April, November and December.
The mean monthly wind speed over the year (meters per second)
Forecast for Reykjavík


Select a Month of Interest
Check the conditions for any month of the year.
The best time of year to visit Reykjavík in Iceland
Other facts from our historical weather data:July has an average maximum temperature of 16°C and is the warmest month of the year.
The coldest month is February with an average maximum temperature of 3°C.
February tops the wettest month list with 148 mm of rainfall.
June is the driest month with 87 mm of precipitation.
May is the sunniest month with an average of 201 hours of sunshine.
No idea where to travel to this year? We have a tool that recommends destinations based on your ideal conditions. Find out where to go with our weather planner.


