Yangdong Weather & Climate: Best Time to Visit
Average temperatures, rainfall, sunshine and the best time to visit Yangdong.
Climate overview of Yangdong
Yangdong, China, sees big temperature differences between seasons, with August peaking at 33°C (91°F) and January dropping to 21°C (70°F).
With around 1914 mm (75 in) of annual rainfall, Yangdong has a notably wet climate. However, this rainfall is not evenly distributed — the city has distinct dry (November to February) and wet (May to September) seasons. The wettest month is June.
Yangdong Weather by Month
Pick a month to see the average temperature, rainfall and sunshine in Yangdong — and find the best time to visit.
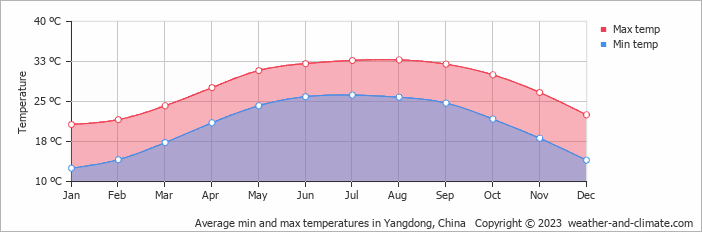
Monthly Temperature in Yangdong
Visitors to Yangdong can expect significant temperature changes throughout the year. Average daytime temperatures reach a very warm 33°C (91°F) in August. In January, the coolest month of the year, temperatures drop to a pleasant 21°C (70°F).
At night, temperatures range from around 26°C (79°F) in August to 13°C (55°F) in January.
Check out our detailed temperature page for more information.
Temperature ranges by month
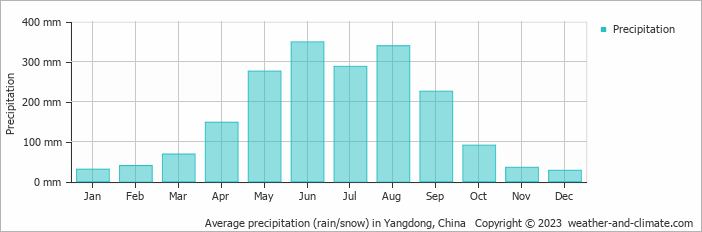
Rainfall in Yangdong
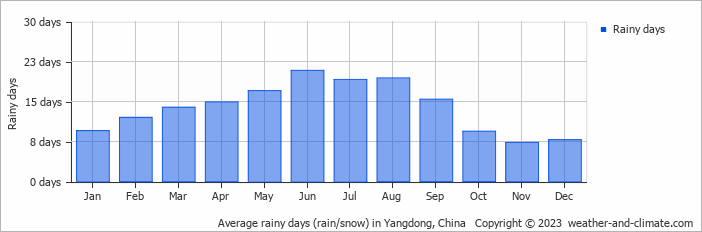
Yangdong is known for its substantial rainfall, with annual precipitation reaching 1914 mm (75 in). Yangdong can be quite wet during June, receiving approximately 349 mm (14 in) of precipitation over 21 rainy days.
In contrast, during the driest month (December), you will experience much drier conditions, with 28 mm (1.1 in) of precipitation spread across 8 rainy days days. For more details, please visit our Yangdong Precipitation page.
The mean monthly precipitation over the year, including rain, hail, and snow
The average number of days each month with precipitation
Best Time to Visit Yangdong
The weather does bring rainfall during this period, between 28 mm (1.1 in) and 148 mm (5.8 in).
Plan accordingly for May, June, July, August and September, when conditions bring the heaviest precipitation. Ready to plan your travels but need destination ideas? Our smart tool recommends places based on the climate conditions you prefer. Start planning with our destination weather tool.
Frequently asked questions about the climate in Yangdong
What is the best time to visit Yangdong?
January, February, March, November and December typically offer the most optimal weather in Yangdong. In contrast, May, June, July, August and September tend to have less optimal conditions. Yangdong has distinct dry (November to February) and wet (May to September) seasons.
What temperatures can I expect in Yangdong?
Daytime highs range from 21°C (70°F) in January to 33°C (91°F) in August. Nighttime lows range from 13°C (55°F) to 26°C (79°F). Temperatures vary considerably through the year.
How much rain does Yangdong get?
Annual rainfall is around 1914 mm (75 in). June is the wettest month with 349 mm (14 in), while December is the driest with 28 mm (1.1 in).
Yangdong 3-Day Forecast
Yangdong 3-Day Forecast
Yangdong on the map
Yangdong is highlighted — select any city to see its climate.
Popular this month
Where to go in July — average daytime high across popular destinations.
Bucket list
Need travel inspiration? Check out our bucket list articles and be inspired.
 The Li River: A Journey Through China’s Most Breathtaking Landscape
Explore the Li River, China's breathtaking landscape with majestic mountains, serene waters, and picturesque views. A must-see for every traveler.
Go to China's Zhangjiajie National Park with the highest, the fastest, largest-loaded outdoor elevator in the world
You won't find this unique landscape anywhere else in the world. Thousands of floating mountains overgrown with trees at the top dominate this fairy tale landscape.
Go to Xinjiang in China
In Xinjiang you get to see a mix of East and Central Asia. An experience that you might want to add to your bucket list. You can travel through the province as if you are following an ancient silk route.
Mount Kailash
The best time for a Kailash tour/trekking is from mid-May to mid-October when the temperature is most pleasant. It is warm, dry and sunny in that period.