Xgħajra Weather & Climate: Best Time to Visit
Average temperatures, rainfall, sunshine and the best time to visit Xgħajra.
Climate overview of Xgħajra
Xgħajra, Malta, sees big temperature differences between seasons, with August peaking at 28°C (82°F) and February dropping to 16°C (61°F).
Rainfall is modest, totalling around 431 mm (17 in) annually. The city experiences a distinct dry season from March to September. December tends to be the wettest month. The most sunshine falls in July, with an average of 12.4 hours of daily sunshine.
Xgħajra Weather by Month
Pick a month to see the average temperature, rainfall and sunshine in Xgħajra — and find the best time to visit.
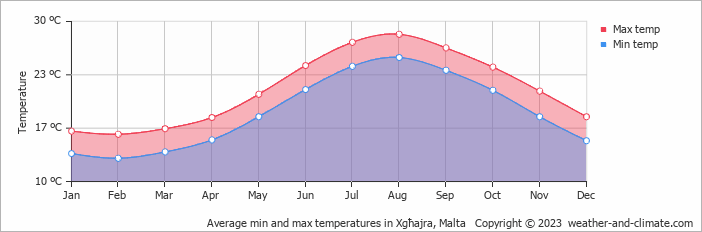
Monthly Temperature in Xgħajra
Visitors to Xgħajra can expect significant temperature changes throughout the year. Average maximum daytime temperatures range from a comfortable 28°C (82°F) in August, the warmest time of the year, to a moderate 16°C (61°F) during cooler months like February.
At night, you can expect temperatures ranging from 26°C (79°F) in August to around 13°C (55°F) during February.
Check out our detailed temperature page for more information.
Temperature ranges by month
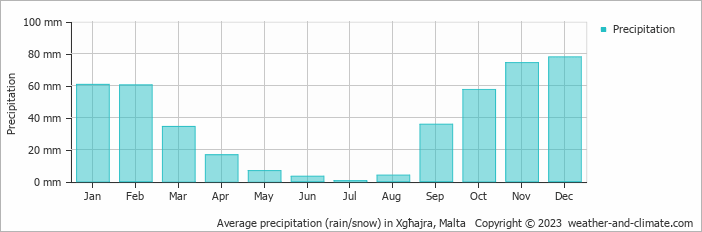
Rainfall in Xgħajra
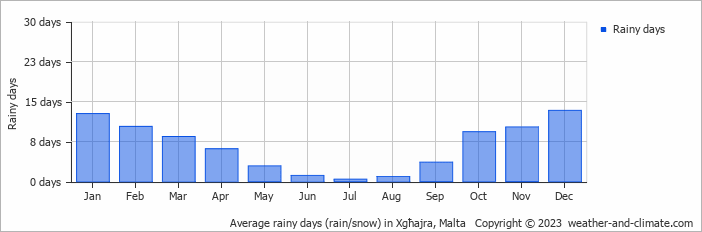
Xgħajra typically sees modest rainfall throughout the year, with an average annual precipitation of 431 mm (17 in). Significant seasonal changes in precipitation occur throughout the year. In the wettest month, December it receives moderate rainfall, averaging 78 mm (3.1 in) of precipitation, recorded across 13 rainy days. In contrast, the driest month July brings less rainfall, with 0.5 mm (0.02 in) over 0 rainy days. For more details, please visit our Xgħajra Precipitation page.
The mean monthly precipitation over the year, including rain, hail, and snow
The average number of days each month with precipitation
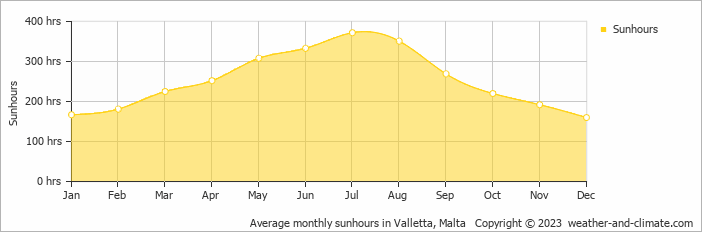
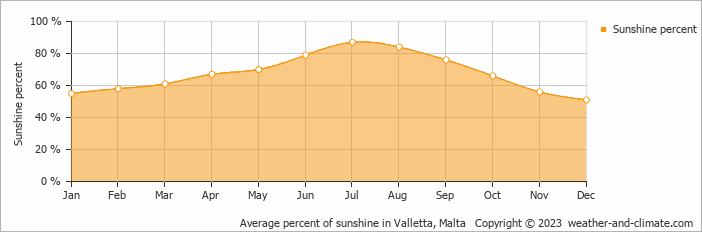
Sunshine Hours in Xgħajra
Seasonal changes in sunshine hours are quite dramatic in Xgħajra. While July receives considerable daily sunshine with up to 12.4 hours, December marks the darkest time of the year, where sunshine is scarce with only 5.3 hours of sunlight per day.
Visit our detailed sunshine hours page for more information.
Monthly hours of sunshine
Daily hours of sunshine
Daily percentage of sunshine
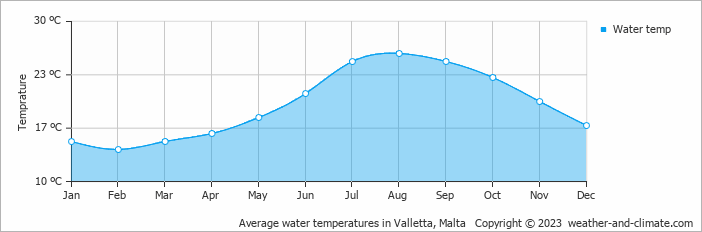
Water Temperature in Xgħajra
The mean water temperature over the year ranges from 14°C (57°F) in February to 26°C (79°F) in August.
Water temperature over the year
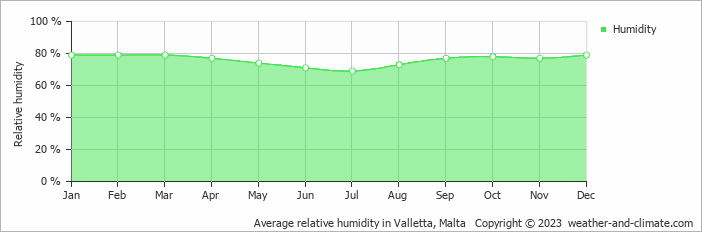
Humidity in Xgħajra by Month
The relative humidity is high throughout the year in Xgħajra.
The city experiences its highest humidity in January, reaching 79%. In July, the humidity drops to its lowest level at 69%. What does this mean? Read our detailed page on humidity levels for further details.
Relative humidity over the year
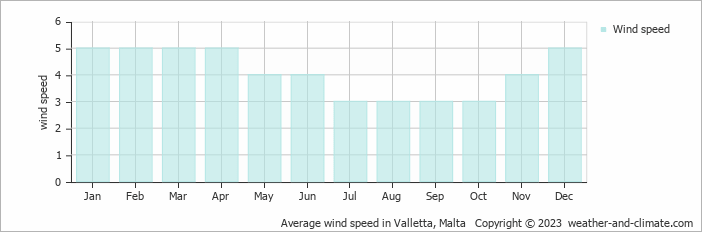
Wind Speed in Xgħajra
The average wind speed over the year ranges from 3 m/s (6 knots) to 5 m/s (10 knots). It is lower in July, August, September and October and higher in January, February, March, April and December. What does this mean?
The mean monthly wind speed over the year (meters per second)
Best Time to Visit Xgħajra
The weather does bring rainfall during this period, between 3 mm (0.1 in) and 74 mm (2.9 in). Looking for inspiration on where to travel this year? We have a tool that recommends destinations based on your ideal conditions. Find out where to go with our weather planner.
Frequently asked questions about the climate in Xgħajra
What is the best time to visit Xgħajra?
April, May, June, July, August, September, October and November typically offer the most optimal weather in Xgħajra. In contrast, January, February and March tend to have less optimal conditions. Xgħajra has a distinct dry season from March to September.
What temperatures can I expect in Xgħajra?
Daytime highs range from 16°C (61°F) in February to 28°C (82°F) in August. Nighttime lows range from 13°C (55°F) to 26°C (79°F). Temperatures vary considerably through the year.
How much rain does Xgħajra get?
Annual rainfall is around 431 mm (17 in). December is the wettest month with 78 mm (3.1 in), while July is the driest with 0.5 mm (0.02 in).
How sunny is Xgħajra?
Xgħajra receives around 3,030 hours of sunshine per year. July is the sunniest month with 372 hours, while December is the cloudiest with just 160 hours. Overall, Xgħajra enjoys abundant sunshine.
Xgħajra 3-Day Forecast
Xgħajra 3-Day Forecast
Xgħajra on the map
Xgħajra is highlighted — select any city to see its climate.
Popular this month
Where to go in July — average daytime high across popular destinations.
Bucket list
Need travel inspiration? Check out our bucket list articles and be inspired.
 Gozo, the best kept secret of the Mediterranean
Gozo is much quieter and smaller than Malta and therefore more authentic. Many Maltese use Gozo as their holiday island.
Discover the unique charm of Malta
This small island nation in the Mediterranean Sea has something for everyone, from endless festivals and celebrations to charming villages and stunning coastal views.