Whangamata Weather & Climate: Best Time to Visit
Average temperatures, rainfall, sunshine and the best time to visit Whangamata.
Climate overview of Whangamata
Whangamata, in New Zealand's Waikato region, varies between warm and mild temperatures as the seasons change. The area gets quite a lot of rain throughout the year, which keeps the coastal vegetation thick and green. This beach town becomes a summer hotspot where Kiwi families go for holidays, surfing, and fishing along the beautiful Coromandel Peninsula coastline. Let's explore the climate details to provide you with a complete overview on when to visit.
Whangamata Weather by Month
Pick a month to see the average temperature, rainfall and sunshine in Whangamata — and find the best time to visit.
Monthly Temperature in Whangamata
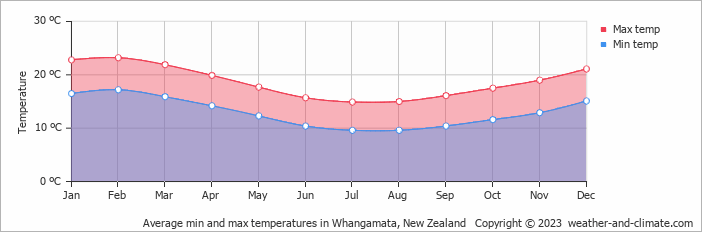
The weather in Whangamata changes moderately throughout the year, offering enough variation to appreciate each season. On average, daytime temperatures range from a comfortable 23°C (73°F) in February to a moderate 15°C (59°F) in July.
Nighttime temperatures range from 17°C (63°F) in February to 10°C (50°F) in July.
Check out our detailed temperature page for more information.
Temperature ranges by month
Rainfall in Whangamata
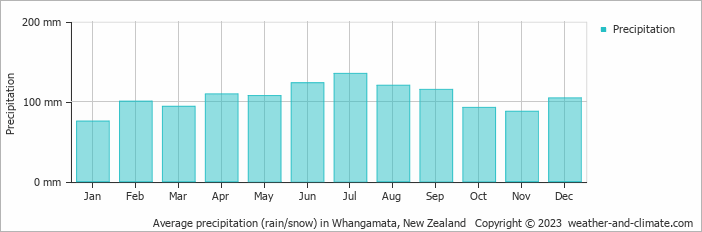
Whangamata has a relatively rainy climate with high precipitation levels, averaging 1263 mm (50 in) of rainfall annually. The amount of precipitation varies moderately throughout the year. The wettest month, July, sees around 135 mm (5.3 in) of rainfall, perfect for those who enjoy a bit of rain now and then. The driest month, January, still receives a respectable 75 mm (3 in) of rainfall. For more details, please visit our Whangamata Precipitation page.
The mean monthly precipitation over the year, including rain, hail, and snow
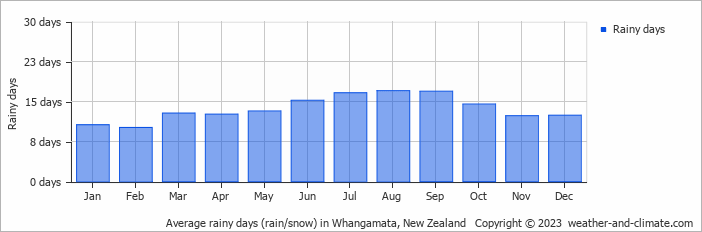
The average number of days each month with precipitation
Sunshine Hours in Whangamata
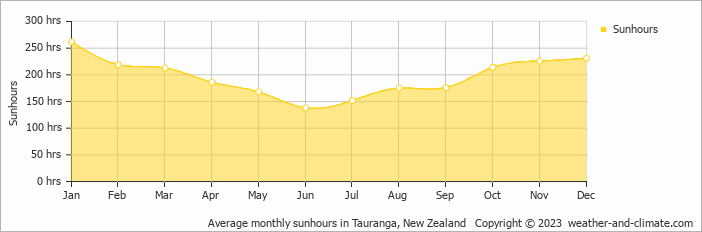
In Whangamata, summer days are longer and more sunny, with daily sunshine hours peaking at 8.7 hours in January. As the darker season arrives, the brightness of the sun becomes less. June sees a soft sun for only 4.6 hours per average day.
Visit our detailed sunshine hours page for more information.
Monthly hours of sunshine
Daily hours of sunshine
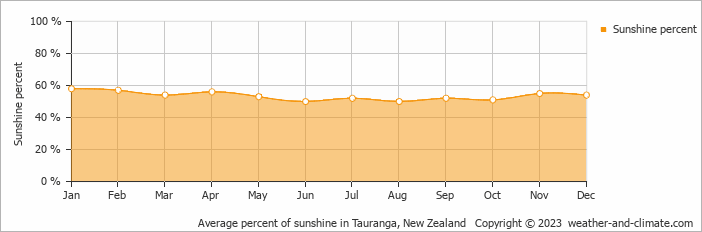
Daily percentage of sunshine
Humidity in Whangamata by Month
The relative humidity is high throughout the year in Whangamata.
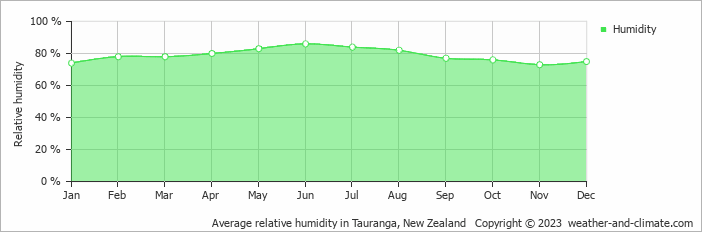
The city experiences its highest humidity in June, reaching 86%. In November, the humidity drops to its lowest level at 73%. What does this mean? Read our detailed page on humidity levels for further details.
Relative humidity over the year
Best Time to Visit Whangamata
Rainfall during this time ranges from 75 mm (3 in) in January to 109 mm (4.3 in) in April. This means you can expect a mix of sunny days and occasional showers. Seeking the perfect travel destination for this year? We've created a tool that suggests locations matching your desired weather. Let our weather planner guide your travel decisions.
Frequently asked questions about the climate in Whangamata
What is the best time to visit Whangamata?
January and March typically offer the most optimal weather in Whangamata. In contrast, June, July, August and September tend to have less optimal conditions.
What temperatures can I expect in Whangamata?
Daytime highs range from 15°C (59°F) in July to 23°C (73°F) in February. Nighttime lows range from 10°C (50°F) to 17°C (63°F).
How much rain does Whangamata get?
Annual rainfall is around 1263 mm (50 in). July is the wettest month with 135 mm (5.3 in), while January is the driest with 75 mm (3 in).
How sunny is Whangamata?
Whangamata receives around 2,360 hours of sunshine per year. January is the sunniest month with 262 hours, while June is the cloudiest with just 138 hours. Overall, Whangamata enjoys abundant sunshine.
Whangamata 3-Day Forecast
Whangamata 3-Day Forecast
Whangamata on the map
Whangamata is highlighted — select any city to see its climate.
Popular this month
Where to go in July — average daytime high across popular destinations.
Bucket list
Need travel inspiration? Check out our bucket list articles and be inspired.
 The Tongariro Crossing in New Zealand
It is called the most beautiful walk in New Zealand, the Tongariro Crossing. The official hiking season starts late October until end of April.
White-water sledge and raft in Rotorua
We recommend to white-water sledge and raft in Rotorua in summer (January, February) when the Glacier melt fills the rivers. This is the best time.