Waipu Weather & Climate: Best Time to Visit
Average temperatures, rainfall, sunshine and the best time to visit Waipu.
Climate overview of Waipu
Waipu, Northland, New Zealand, experiences moderate temperature changes through the seasons. February is the warmest month with daytime highs of 24°C (75°F), while July is the coolest at 16°C (61°F).
Rainfall is high, totalling around 1086 mm (43 in) per year. July is the wettest month and January the driest.
Waipu Weather by Month
Pick a month to see the average temperature, rainfall and sunshine in Waipu - and find the best time to visit.
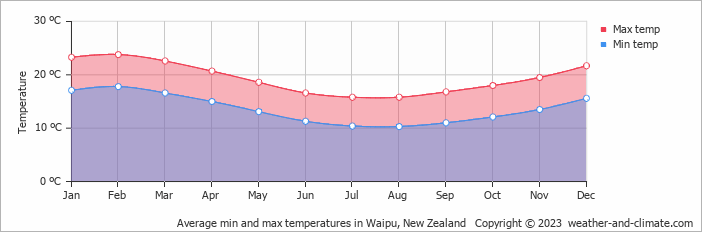
Monthly Temperature in Waipu
In Waipu, seasonal changes bring about a moderate variation in temperatures. Average maximum daytime temperatures range from a comfortable 24°C (75°F) in February, the warmest time of the year, to a moderate 16°C (61°F) during cooler months like July.
At night, you can expect temperatures ranging from 18°C (64°F) in February to around 10°C (50°F) during July.
Check out our detailed temperature page for more information.
Temperature ranges by month
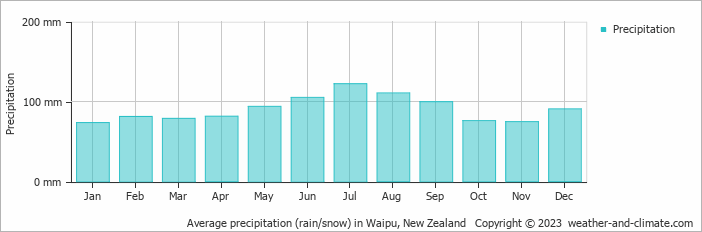
Rainfall in Waipu
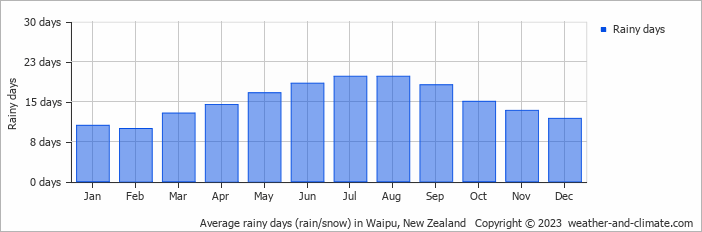
Waipu has a relatively rainy climate with high precipitation levels, averaging 1086 mm (43 in) of rainfall annually. While rainfall varies throughout the year, each season offers its own charm. July brings wetter days averaging 122 mm (4.8 in) of precipitation, spread over 20 rainy days.
In contrast, the driest month January experiences a drier climate, with about 73 mm (2.9 in) of rainfall spread across 11 rainy days. For more details, please visit our Waipu Precipitation page.
The mean monthly precipitation over the year, including rain, hail, and snow
The average number of days each month with precipitation
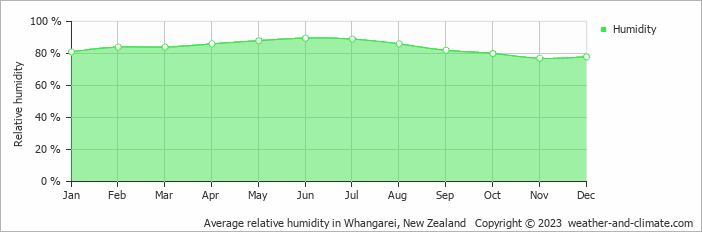
Humidity in Waipu by Month
The city experiences its highest humidity in June, reaching 90%. In November, the humidity drops to its lowest level at 77%. What does this mean? Read our detailed page on humidity levels for further details.
Relative humidity over the year
Best Time to Visit Waipu
Monthly ratings reflect general weather comfort, based on daytime temperature and rainfall. Swimming and winter conditions are highlighted separately where relevant.
- Best overall: January, February, March, April, November and December
- Warmest weather: January, February and March
- Fewest rainy days: January, February and December
Frequently asked questions about the climate in Waipu
What is the best time to visit Waipu?
January, February, March, April, November and December typically offer the most optimal weather in Waipu. In contrast, June, July, August and September tend to have less optimal conditions.
What temperatures can I expect in Waipu?
Daytime highs range from 16°C (61°F) in July to 24°C (75°F) in February. Nighttime lows range from 10°C (50°F) to 18°C (64°F).
How much rain does Waipu get?
Annual rainfall is around 1086 mm (43 in). July is the wettest month with 122 mm (4.8 in), while January is the driest with 73 mm (2.9 in).
Waipu 3-Day Forecast
Waipu 3-Day Forecast
Waipu on the map
Waipu is highlighted - select any city to see its climate.
Popular this month
Where to go in July - average daytime high across popular destinations.
Bucket list
Need travel inspiration? Check out our bucket list articles and be inspired.
 The Tongariro Crossing in New Zealand
It is called the most beautiful walk in New Zealand, the Tongariro Crossing. The official hiking season starts late October until end of April.
White-water sledge and raft in Rotorua
We recommend to white-water sledge and raft in Rotorua in summer (January, February) when the Glacier melt fills the rivers. This is the best time.