Tori Weather & Climate: Best Time to Visit
Average temperatures, rainfall, sunshine and the best time to visit Tori.
Climate overview of Tori
Tori, Pärnumaa, Estonia, sees big temperature differences between seasons, with July peaking at 24°C (75°F) and February dropping to 0°C (32°F).
The city receives around 782 mm (31 in) of rain/snowfall per year. August is the wettest month and March the driest. The sunniest month is July, with 10.3 hours of sunshine per day on average.
Tori Weather by Month
Pick a month to see the average temperature, rainfall and sunshine in Tori — and find the best time to visit.
Monthly Temperature in Tori
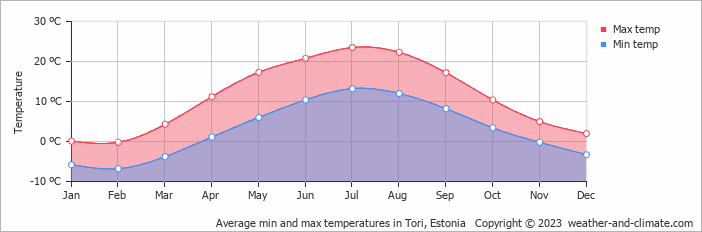
Visitors to Tori can expect significant temperature changes throughout the year. On average, daytime temperatures range from a comfortable 24°C (75°F) in July to a very cold 0°C (32°F) in February.
Nighttime temperatures range from 13°C (55°F) in July to -7°C (19°F) in February.
Check out our detailed temperature page for more information.
Temperature ranges by month
Rainfall in Tori
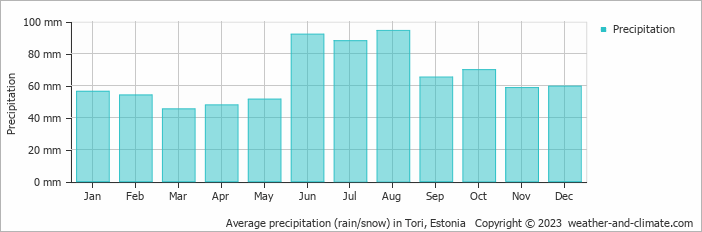
Generally, Tori experiences moderate precipitation patterns, averaging 782 mm (31 in) yearly. The amount of precipitation varies moderately throughout the year. The wettest month, August, sees around 94 mm (3.7 in) of rainfall, perfect for those who enjoy a bit of rain now and then. The driest month, March, still receives a respectable 45 mm (1.8 in) of snow/rainfall. For more details, please visit our Tori Precipitation page.
The mean monthly precipitation over the year, including rain, hail, and snow
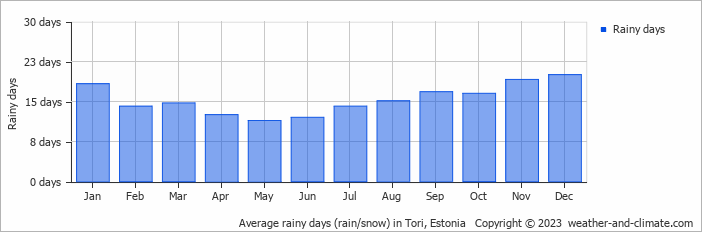
The average number of days each month with precipitation
Sunshine Hours in Tori
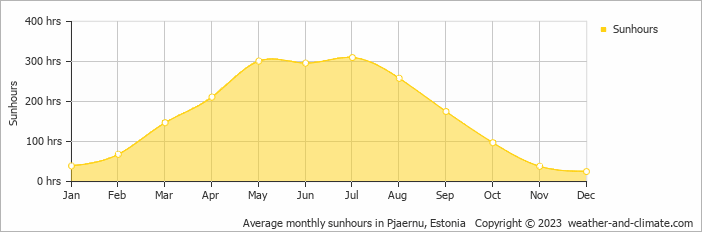
In Tori, summer days are longer and more sunny, with daily sunshine hours peaking at 10.3 hours in July. As the darker season arrives, the brightness of the sun becomes less. December sees a soft sun for only 0.8 hours per average day.
Visit our detailed sunshine hours page for more information.
Monthly hours of sunshine
Daily hours of sunshine
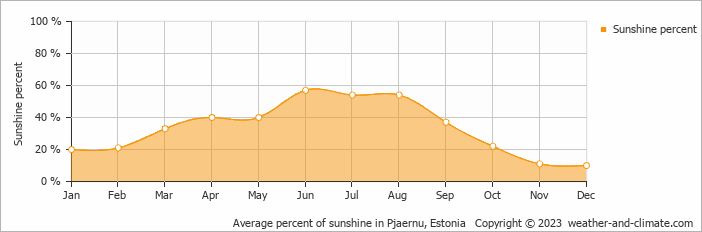
Daily percentage of sunshine
Humidity in Tori by Month
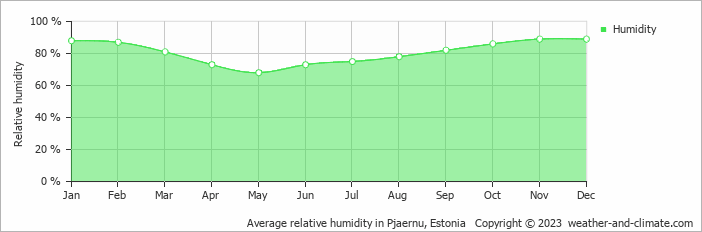
The city experiences its highest humidity in November, reaching 89%. In May, the humidity drops to its lowest level at 68%. What does this mean? Read our detailed page on humidity levels for further details.
Relative humidity over the year
Best Time to Visit Tori
The weather does bring rainfall during this period, between 88 mm (3.5 in) and 94 mm (3.7 in). Seeking the perfect travel destination for this year? We've created a tool that suggests locations matching your desired weather. Let our weather planner guide your travel decisions.
Frequently asked questions about the climate in Tori
What is the best time to visit Tori?
June, July and August typically offer the most optimal weather in Tori. In contrast, January, February, March, October, November and December tend to have less optimal conditions.
What temperatures can I expect in Tori?
Daytime highs range from 0°C (32°F) in February to 24°C (75°F) in July. Nighttime lows range from -7°C (19°F) to 13°C (55°F). Temperatures vary considerably through the year.
How much rain does Tori get?
Annual rainfall is around 782 mm (31 in). August is the wettest month with 94 mm (3.7 in), while March is the driest with 45 mm (1.8 in).
How sunny is Tori?
Tori receives around 1,965 hours of sunshine per year. July is the sunniest month with 310 hours, while December is the cloudiest with just 25 hours.
Tori 3-Day Forecast
Tori 3-Day Forecast
Tori on the map
Tori is highlighted — select any city to see its climate.
Popular this month
Where to go in July — average daytime high across popular destinations.