Saint-Cergue Climate by Month
Saint-Cergue experiences great temperature shifts.
The city's weather can transition from warm days
to cold weather.
It also has a notably wet climate with much precipitation.
Now, let’s explore all the climate details to give you a full picture.
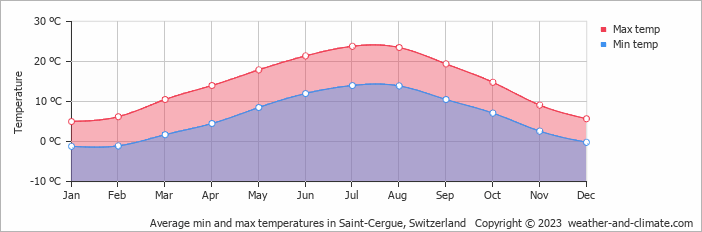
Average day and night temperature
The climate in Saint-Cergue is known for significant temperature differences throughout the year, making the weather dynamic. Average daytime temperatures range from a comfortable 24°C in July, the warmest time of the year, to a chilly 5°C during cooler months like January. At night, temperatures typically average around -1°C during these months.
The mean minimum and maximum temperatures throughout the year
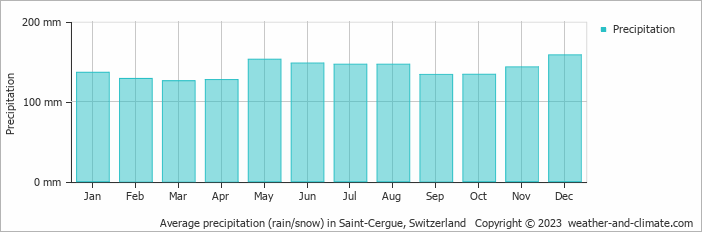
Precipitation and rainy days
Saint-Cergue has a notably wet climate with abundant precipitation, recording 1680 mm of rain/snowfall per year. Year-round, Saint-Cergue has a balanced climate with minimal variation in precipitation. The difference between the wettest month, December, with 158 mm, and the driest month, March, with 126 mm, is minimal.The mean monthly precipitation over the year, including rain, hail and snow
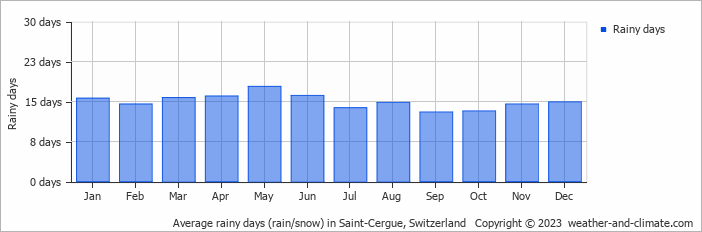
The average number of days each month with precipitation
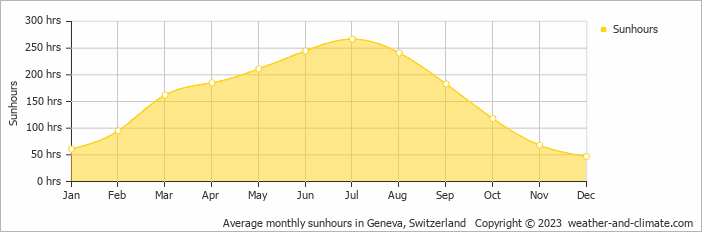
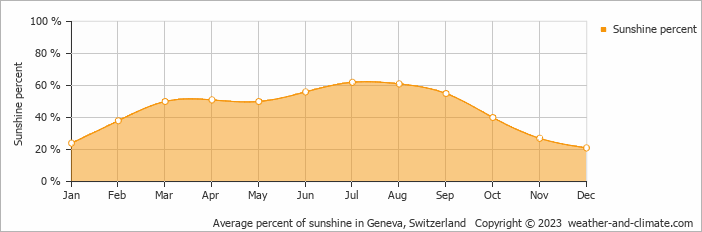
Sunshine over the year
Seasonal changes in sunshine hours are quite dramatic in Saint-Cergue. While July receives considerable daily sunshine with up to 8.9 hours, December marks the darkest time of the year, where sunshine is scarce with only 1.6 hours of sunlight per day.Monthly hours of sunshine
Daily hours of sunshine
Daily percentage of sunshine
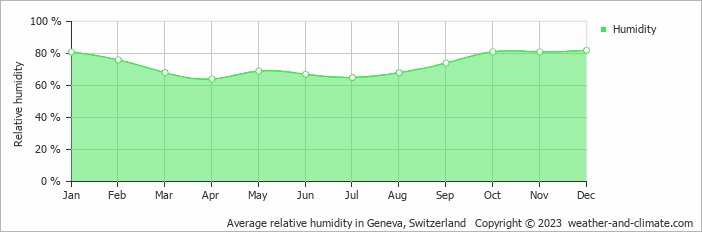
Average humidity
The relative humidity is moderate throughout the year in Saint-Cergue.
Relative humidity over the year
The best time of year to visit Saint-Cergue in Switzerland
During the months of June, July and August you are most likely to experience good weather with pleasant average temperatures that fall between 20°C and 26°C.Other facts from our historical weather data:
Most rainfall (rainy season) is seen in May and December.
July has an average maximum temperature of 24°C and is the warmest month of the year.
The coldest month is January with an average maximum temperature of 5°C.
December tops the wettest month list with 158 mm of rainfall.
March is the driest month with 126 mm of precipitation.
July is the sunniest month with an average of 267 hours of sunshine.
No idea where to travel to this year? We have a tool that recommends destinations based on your ideal conditions. Find out where to go with our weather planner.