Plombières Weather & Climate: Best Time to Visit
Average temperatures, rainfall, sunshine and the best time to visit Plombières.
Climate overview of Plombières
The climate in Plombières, Liege Province, Belgium, is marked by large temperature swings across the seasons, ranging from 24°C (75°F) in July to 6°C (43°F) in January.
Plombières sees a moderate amount of rain/snowfall, totalling around 953 mm (38 in) per year. It experiences warm summers and cold winters, creating some seasonal variation. The most sunshine falls in July, with an average of 7.0 hours of daily sunshine.
Plombières Weather by Month
Pick a month to see the average temperature, rainfall and sunshine in Plombières - and find the best time to visit.
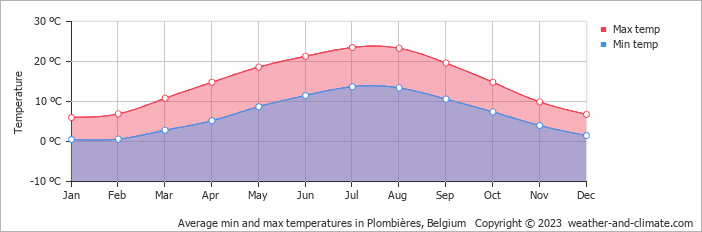
Monthly Temperature in Plombières
In Plombières, temperatures differ significantly between summer and winter months. Average maximum daytime temperatures range from a comfortable 24°C (75°F) in July, the warmest time of the year, to a chilly 6°C (43°F) during cooler months like January.
At night, you can expect temperatures ranging from 14°C (57°F) in July to around 1°C (34°F) during January.
Check out our detailed temperature page for more information.
Temperature ranges by month
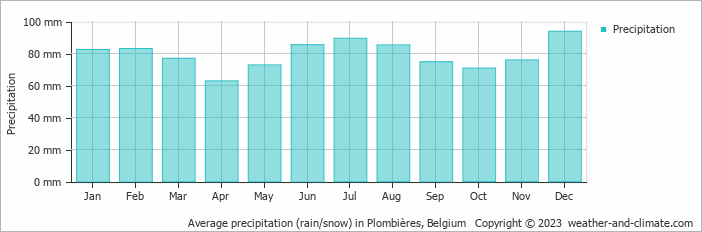
Rainfall in Plombières
On average, Plombières receives a reasonable amount of rain/snowfall, with an annual precipitation of 953 mm (38 in). Year-round, Plombières has a balanced climate with minimal variation in precipitation. The difference between the wettest month, December, with 94 mm (3.7 in), and the driest month, April, with 63 mm (2.5 in), is minimal. For more details, please visit our Plombières Precipitation page.
The mean monthly precipitation over the year, including rain, hail, and snow
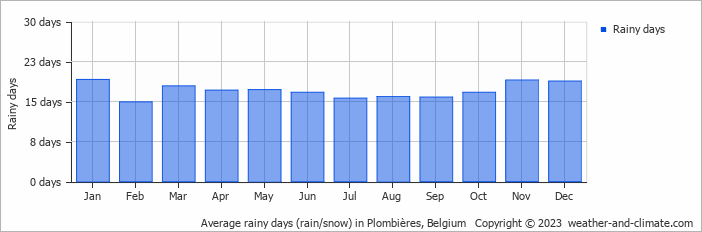
The average number of days each month with precipitation
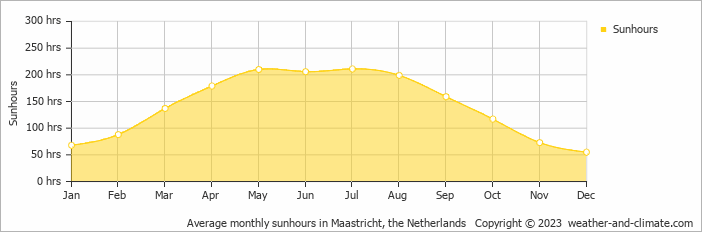
Sunshine Hours in Plombières
Seasonal changes in sunshine hours are quite dramatic in Plombières. While July receives considerable daily sunshine with up to 7.0 hours, December marks the darkest time of the year, where sunshine is scarce with only 1.8 hours of sunlight per day.
Visit our detailed sunshine hours page for more information.
Monthly hours of sunshine
Daily hours of sunshine
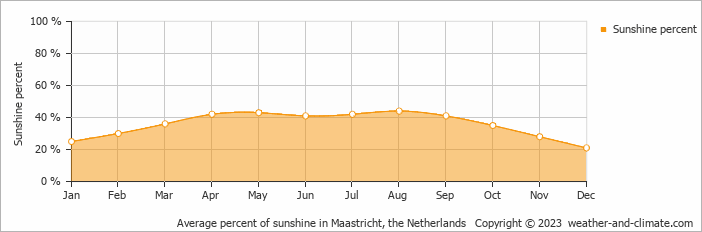
Daily percentage of sunshine
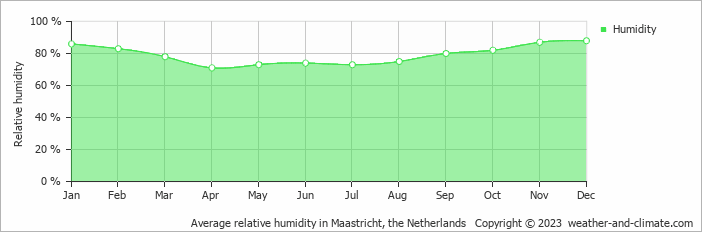
Humidity in Plombières by Month
The relative humidity is high throughout the year in Plombières.
The city experiences its highest humidity in December, reaching 88%. In April, the humidity drops to its lowest level at 71%. What does this mean? Read our detailed page on humidity levels for further details.
Relative humidity over the year
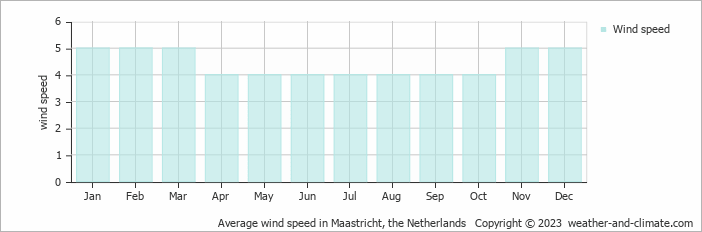
Wind Speed in Plombières
The mean wind speed varies between 4 m/s (8 knots) and 5 m/s (10 knots) throughout the year. It is lowest in April, May, June, July, August, September and October and highest during January, February, March, November and December. What does this mean?
The mean monthly wind speed over the year (meters per second)
Best Time to Visit Plombières
Monthly ratings reflect general weather comfort, based on daytime temperature and rainfall. Swimming and winter conditions are highlighted separately where relevant.
- Best overall: June, July, August and September
- Warmest weather: July and August
- Most sunshine: May, June and July
- Seasonal pattern: Warm summers and cold winters
Frequently asked questions about the climate in Plombières
What is the best time to visit Plombières?
June, July, August and September typically offer the most optimal weather in Plombières. In contrast, January, February, November and December tend to have less optimal conditions. Plombières has warm summers and cold winters.
What temperatures can I expect in Plombières?
Daytime highs range from 6°C (43°F) in January to 24°C (75°F) in July. Nighttime lows range from 1°C (34°F) to 14°C (57°F). Temperatures vary considerably through the year.
How much rain does Plombières get?
Annual rainfall is around 953 mm (38 in). December is the wettest month with 94 mm (3.7 in), while April is the driest with 63 mm (2.5 in).
How sunny is Plombières?
Plombières receives around 1,702 hours of sunshine per year. July is the sunniest month with 211 hours, while December is the cloudiest with just 55 hours.
Plombières 3-Day Forecast
Plombières 3-Day Forecast
Plombières on the map
Plombières is highlighted - select any city to see its climate.
Popular this month
Where to go in July - average daytime high across popular destinations.
Bucket list
Need travel inspiration? Check out our bucket list articles and be inspired.
 Do a pub crawl in Antwerp
You can visit Antwerp year round however May through September is the best time to go to Antwerp for a pub crawl. Late spring is recommended for its long days.
Discover the green beauty of Belgium's Ardennes
Uncover Belgium's Ardennes: Outdoor adventures, history, relaxation, and local delights await in this green travel paradise