Old Barag Weather & Climate: Best Time to Visit
Average temperatures, rainfall, sunshine and the best time to visit Old Barag.
Climate overview of Old Barag
Old Barag, China, experiences significant temperature variation throughout the year. Summers bring daytime highs of 28°C (82°F) in July, while winters cool to -18°C (0°F) in January.
With around 405 mm (16 in) of annual rain/snowfall, Old Barag has a fairly dry climate. However, it has a distinct dry season from October to May. The wettest month is July, while January sees the least rain. The sunniest month is June, with 10.0 hours of sunshine per day on average.
Old Barag Weather by Month
Pick a month to see the average temperature, rainfall and sunshine in Old Barag — and find the best time to visit.
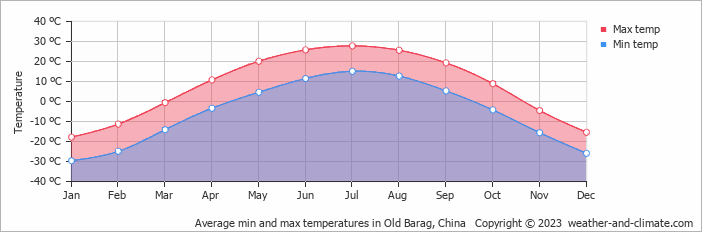
Monthly Temperature in Old Barag
Depending on the time of the year, temperatures range from comfortable to very cold in Old Barag. Average daytime temperatures reach a comfortable 28°C (82°F) in July. In January, the coolest month of the year, temperatures drop to a very cold -18°C (0°F).
At night, temperatures range from around 15°C (59°F) in July to -30°C (-22°F) in January.
Check out our detailed temperature page for more information.
Temperature ranges by month
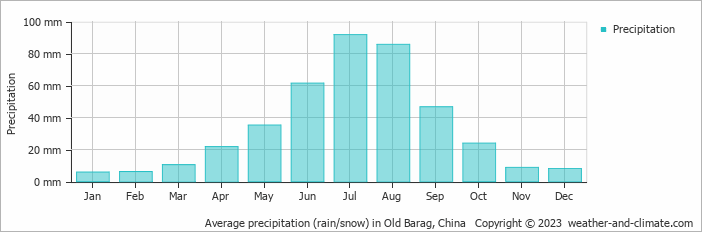
Rainfall in Old Barag
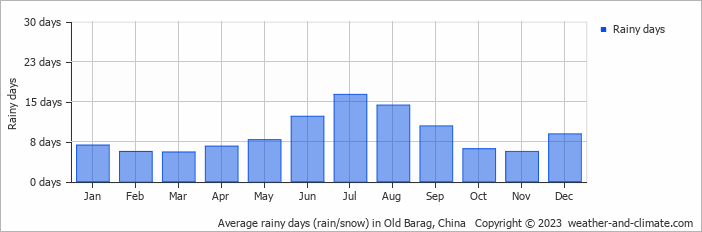
With annual rain/snowfall averaging 405 mm (16 in), Old Barag maintains relatively low precipitation levels throughout the seasons. Old Barag can be quite wet during July, receiving approximately 92 mm (3.6 in) of precipitation over 16 rainy days.
In contrast, during the driest month (January), you will experience much drier conditions, with 5.8 mm (0.2 in) of precipitation spread across 7 snowy days days. For more details, please visit our Old Barag Precipitation page.
The mean monthly precipitation over the year, including rain, hail, and snow
The average number of days each month with precipitation
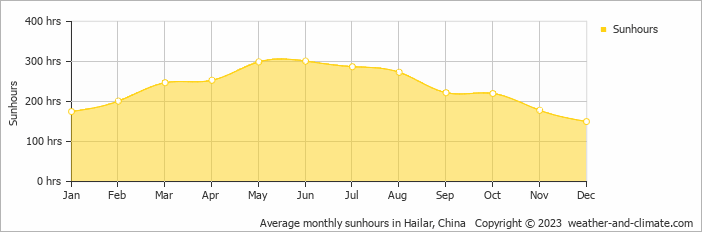
Sunshine Hours in Old Barag
Old Barag can be enjoyed more throughout the sunniest month of June under a blue sky, with approximately 10.0 hours of sunshine daily. In contrast, the city experiences much darker days in December, with only 5.0 hours of sunlight per day.
Visit our detailed sunshine hours page for more information.
Monthly hours of sunshine
Daily hours of sunshine
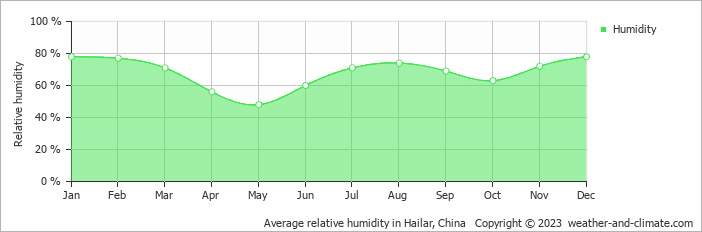
Humidity in Old Barag by Month
The relative humidity is high throughout the year in Old Barag.
The city experiences its highest humidity in January, reaching 78%. In May, the humidity drops to its lowest level at 48%. What does this mean? Read our detailed page on humidity levels for further details.
Relative humidity over the year
Best Time to Visit Old Barag
Rainfall during this time ranges from 22 mm (0.9 in) in April to 47 mm (1.9 in) in September. This means you can expect a mix of sunny days and occasional showers. Wondering where to travel based on your weather preferences? Our recommendation tool helps you find destinations with your ideal climate conditions. Use our weather planner to find your perfect destination.
Frequently asked questions about the climate in Old Barag
What is the best time to visit Old Barag?
May, June, July and August typically offer the most optimal weather in Old Barag. In contrast, January, February, March, November and December tend to have less optimal conditions. Old Barag has a distinct dry season from October to May.
What temperatures can I expect in Old Barag?
Daytime highs range from -18°C (0°F) in January to 28°C (82°F) in July. Nighttime lows range from -30°C (-22°F) to 15°C (59°F). Temperatures vary considerably through the year.
How much rain does Old Barag get?
Annual rainfall is around 405 mm (16 in). July is the wettest month with 92 mm (3.6 in), while January is the driest with 5.8 mm (0.2 in).
How sunny is Old Barag?
Old Barag receives around 2,806 hours of sunshine per year. June is the sunniest month with 301 hours, while December is the cloudiest with just 150 hours. Overall, Old Barag enjoys abundant sunshine.
Old Barag 3-Day Forecast
Old Barag 3-Day Forecast
Old Barag on the map
Old Barag is highlighted — select any city to see its climate.
Popular this month
Where to go in July — average daytime high across popular destinations.
Bucket list
Need travel inspiration? Check out our bucket list articles and be inspired.
 The Li River: A Journey Through China’s Most Breathtaking Landscape
Explore the Li River, China's breathtaking landscape with majestic mountains, serene waters, and picturesque views. A must-see for every traveler.
Go to China's Zhangjiajie National Park with the highest, the fastest, largest-loaded outdoor elevator in the world
You won't find this unique landscape anywhere else in the world. Thousands of floating mountains overgrown with trees at the top dominate this fairy tale landscape.
Go to Xinjiang in China
In Xinjiang you get to see a mix of East and Central Asia. An experience that you might want to add to your bucket list. You can travel through the province as if you are following an ancient silk route.
Mount Kailash
The best time for a Kailash tour/trekking is from mid-May to mid-October when the temperature is most pleasant. It is warm, dry and sunny in that period.