Lucciana Weather & Climate: Best Time to Visit
Average temperatures, rainfall, sunshine and the best time to visit Lucciana.
Climate overview of Lucciana
Lucciana, Corsica, France, experiences significant temperature variation throughout the year. Summers bring daytime highs of 28°C (82°F) in August, while winters cool to 13°C (55°F) in February.
With around 825 mm (32 in) of annual rainfall, the city has moderate precipitation levels. November is the wettest month and July the driest. It also has a distinct dry season from July to August. The most sunshine falls in July, with an average of 11.5 hours of daily sunshine.
Lucciana Weather by Month
Pick a month to see the average temperature, rainfall and sunshine in Lucciana — and find the best time to visit.
Monthly Temperature in Lucciana
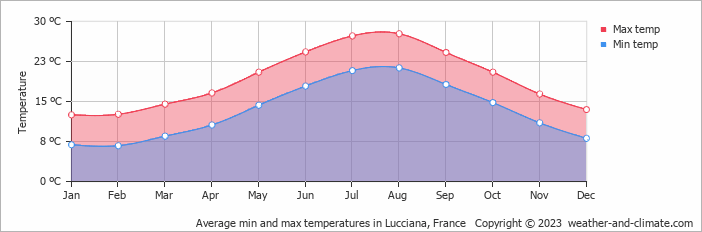
Depending on the time of the year, temperatures range from comfortable to moderate in Lucciana. Typically, average maximum daytime temperatures range from a comfortable 28°C (82°F) in August to a moderate 13°C (55°F) in the coolest month, February.
Nights vary from 21°C (70°F) in August to around 7°C (45°F) during the colder months.
Check out our detailed temperature page for more information.
Temperature ranges by month
Rainfall in Lucciana
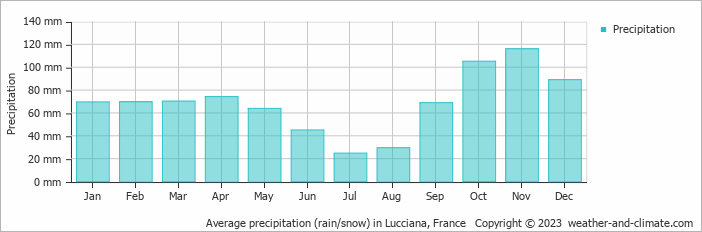
Generally, Lucciana has a moderate amount of precipitation, averaging 825 mm (32 in) of rainfall annually. The climate in Lucciana shows significant variation throughout the year. Expect high rainfall in November, the wettest month, with an average of 116 mm (4.6 in) of precipitation over 13 rainy days.
In contrast, the driest month July offers drier and sunnier days, with around 25 mm (1 in) of rainfall over 4 rainy days. For more details, please visit our Lucciana Precipitation page.
The mean monthly precipitation over the year, including rain, hail, and snow
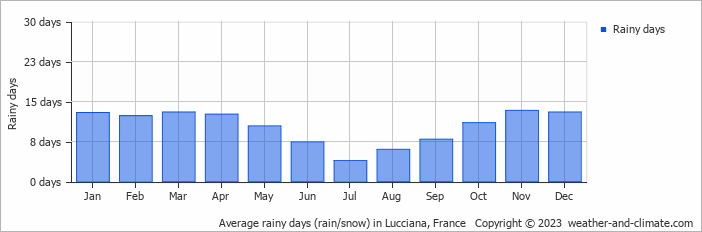
The average number of days each month with precipitation
Sunshine Hours in Lucciana
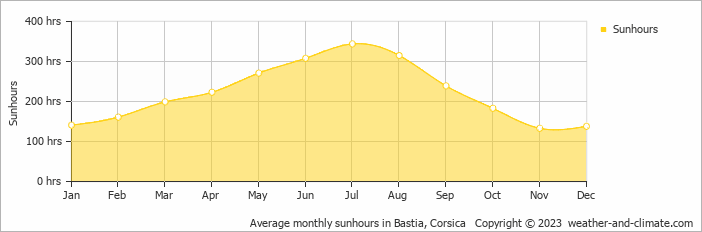
For those who appreciate different seasons, Lucciana serves as an ideal destination. Expect longer, more sun-filled days in July with an average of 11.5 hours of sunshine daily, and embrace the darker days in November, offering only 4.4 hours of daily sunlight.
Visit our detailed sunshine hours page for more information.
Monthly hours of sunshine
Daily hours of sunshine
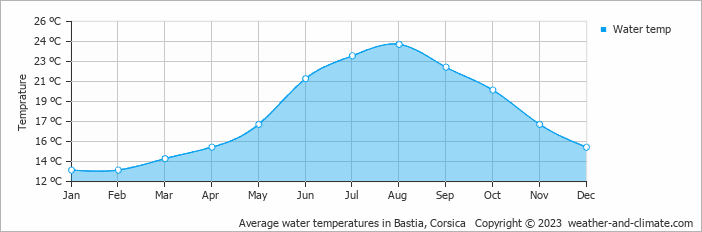
Water Temperature in Lucciana
The mean water temperature over the year ranges from 13°C (55°F) in January to 24°C (75°F) in August.
Water temperature over the year
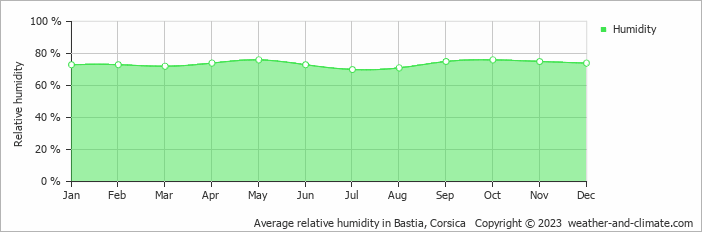
Humidity in Lucciana by Month
The relative humidity is high throughout the year in Lucciana.
The city experiences its highest humidity in May, reaching 76%. In July, the humidity drops to its lowest level at 70%. What does this mean? Read our detailed page on humidity levels for further details.
Relative humidity over the year
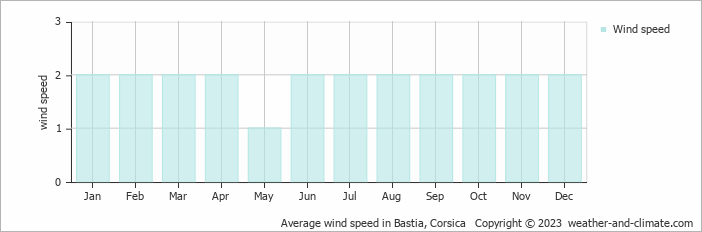
Wind Speed in Lucciana
The mean wind speed varies between 1 m/s (2 knots) and 2 m/s (4 knots) throughout the year. It is lowest in May and highest during January, February, March, April, June, July, August, September, October, November and December. What does this mean?
The mean monthly wind speed over the year (meters per second)
Best Time to Visit Lucciana
Rainfall during this time ranges from 25 mm (1 in) in July to 105 mm (4.1 in) in October. This means you can expect a mix of sunny days and occasional showers. Planning your next adventure but unsure where to go? Our climate tool suggests perfect locations tailored to your preferred weather conditions. Discover your ideal travel destination with our weather planner.
Frequently asked questions about the climate in Lucciana
What is the best time to visit Lucciana?
May, June, July, August and September typically offer the most optimal weather in Lucciana. In contrast, January, February and November tend to have less optimal conditions. Lucciana has a distinct dry season from July to August.
What temperatures can I expect in Lucciana?
Daytime highs range from 13°C (55°F) in February to 28°C (82°F) in August. Nighttime lows range from 7°C (45°F) to 21°C (70°F). Temperatures vary considerably through the year.
How much rain does Lucciana get?
Annual rainfall is around 825 mm (32 in). November is the wettest month with 116 mm (4.6 in), while July is the driest with 25 mm (1 in).
How sunny is Lucciana?
Lucciana receives around 2,655 hours of sunshine per year. July is the sunniest month with 344 hours, while November is the cloudiest with just 133 hours. Overall, Lucciana enjoys abundant sunshine.
Lucciana 3-Day Forecast
Lucciana 3-Day Forecast
Lucciana on the map
Lucciana is highlighted — select any city to see its climate.
Popular this month
Where to go in July — average daytime high across popular destinations.
Bucket list
Need travel inspiration? Check out our bucket list articles and be inspired.
 The 10 most charming villages in France
Discover France's top 10 beautiful villages. From Normandy to the Côte d'Azur, experience quaint squares and cobbled streets. Which one will you visit this summer?
An alternative way to discover Paris
From street art, vintage shops, vegetarian cafes, to amazing cultural events, Paris has much to offer for the creative traveler. An overview of sights that you must see if you want to visit this city in an alternative way.
Nature is allowed to take its course in the Ardeche
The Ardèche is France at its most beautiful. The authentic villages and breathtaking mountainous landscapes are one of the main reasons. he climate in Ardèche is very pleasant. Temperatures are high during summer and it is often very sunny.
 Explore the natural wonders of Corsica
Corsica offers an abundance of incredible natural wonders to explore. This stunning Mediterranean island is a paradise for outdoor enthusiasts and nature lovers alike.