Layton (FL) Weather & Climate: Best Time to Visit
Average temperatures, rainfall, sunshine and the best time to visit Layton.
Climate overview of Layton
Layton, Florida, United States of America, has a stable climate with little temperature variation across the year. Average daytime temperatures hover around 22°C (72°F), peaking in August at 25°C (77°F) and dipping in January to 19°C (66°F).
With around 943 mm (37 in) of annual rainfall, the city has moderate precipitation levels. September is the wettest month and March the driest. The most sunshine falls in May, with an average of 11.4 hours of daily sunshine.
Layton Weather by Month
Pick a month to see the average temperature, rainfall and sunshine in Layton — and find the best time to visit.
Monthly Temperature in Layton
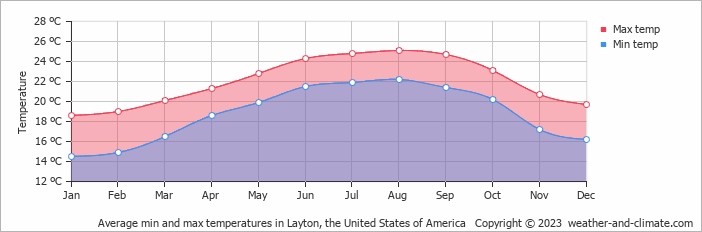
With minimal seasonal shifts, Layton experiences a constant climate year-round. Typically, average maximum daytime temperatures range from a comfortable 25°C (77°F) in August to a pleasant 19°C (66°F) in the coolest month, January.
Nights vary from 22°C (72°F) in August to around 15°C (59°F) during the colder months.
Check out our detailed temperature page for more information.
Temperature ranges by month
Rainfall in Layton
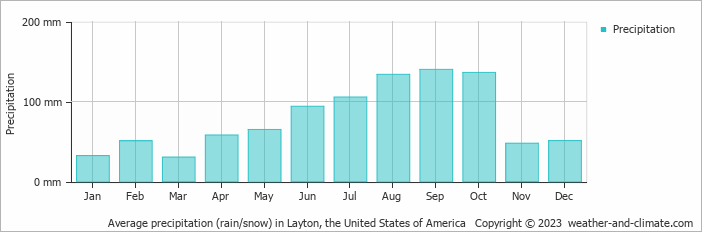
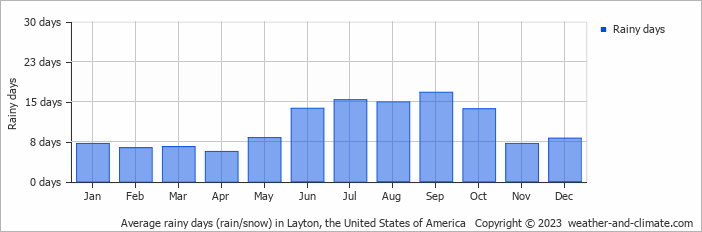
Generally, Layton receives mid-range precipitation levels, with 943 mm (37 in) annually. The climate in Layton shows significant variation throughout the year. Expect high rainfall in September, the wettest month, with an average of 140 mm (5.5 in) of precipitation over 17 rainy days.
In contrast, the driest month March offers drier and sunnier days, with around 30 mm (1.2 in) of rainfall over 7 rainy days. For more details, please visit our Layton Precipitation page.
The mean monthly precipitation over the year, including rain, hail, and snow
The average number of days each month with precipitation
Sunshine Hours in Layton
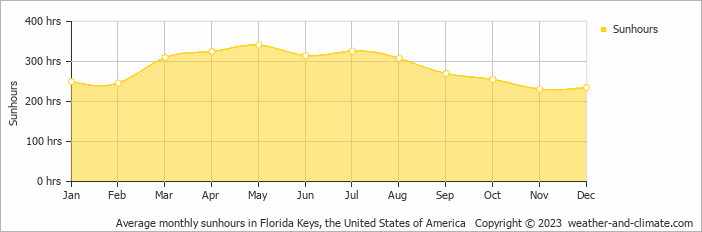
Layton offers a pleasant mix of sunny and slightly overcast days. The difference in sunshine hours between May (11.4 hours daily) and November (7.7 hours daily) provides a bit of variety for visitors and residents.
Visit our detailed sunshine hours page for more information.
Monthly hours of sunshine
Daily hours of sunshine
Daily percentage of sunshine
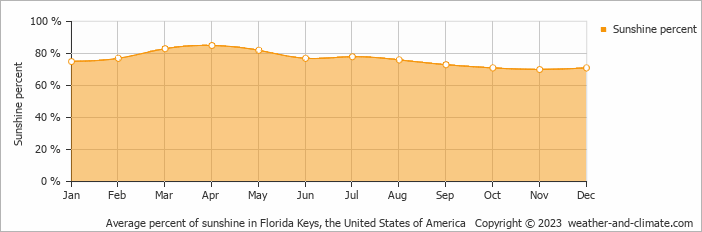
Humidity in Layton by Month
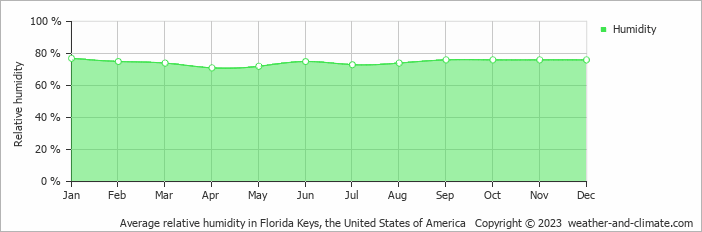
The relative humidity is high throughout the year in Layton.
The city experiences its highest humidity in January, reaching 77%. In April, the humidity drops to its lowest level at 71%. What does this mean? Read our detailed page on humidity levels for further details.
Relative humidity over the year
Best Time to Visit Layton
The varied rainfall (from 30 mm (1.2 in) to 140 mm (5.5 in)) creates diverse landscapes throughout the year. For the best outdoor conditions, plan your visit during the drier months like March. Wondering where to travel based on your weather preferences? Our recommendation tool helps you find destinations with your ideal climate conditions. Use our weather planner to find your perfect destination.
Frequently asked questions about the climate in Layton
What is the best time to visit Layton?
March, April, May, June, November and December typically offer the most optimal weather in Layton. In contrast, January, February, July, August, September and October tend to have less optimal conditions.
What temperatures can I expect in Layton?
Daytime highs range from 19°C (66°F) in January to 25°C (77°F) in August. Nighttime lows range from 15°C (59°F) to 22°C (72°F). Temperatures stay relatively stable year-round.
How much rain does Layton get?
Annual rainfall is around 943 mm (37 in). September is the wettest month with 140 mm (5.5 in), while March is the driest with 30 mm (1.2 in).
How sunny is Layton?
Layton receives around 3,412 hours of sunshine per year. May is the sunniest month with 341 hours, while November is the cloudiest with just 231 hours. Overall, Layton enjoys abundant sunshine.
Layton 3-Day Forecast
Layton (FL) 3-Day Forecast
Layton on the map
Layton is highlighted — select any city to see its climate.
Popular this month
Where to go in July — average daytime high across popular destinations.
Bucket list
Need travel inspiration? Check out our bucket list articles and be inspired.
 Yosemite National Park is definitely worth a visit
Vast forests, blue lakes, towering sequoias, and majestic waterfalls hint at the beauty of Yosemite National Park—a true natural masterpiece.
The 10 most alternative cities in the United States
Discover the top 10 fun and alternative U.S. cities rich in art, culture, and adventure. From Portland's hippy charm to Sedona's stunning landscapes.
Sedona: Explore Majestic Red Rock Landscapes
A picturesque artists' town surrounded by red rocks and known for its spirituality, vortex energy, and stunning hikes like Cathedral Rock.
10 most idyllic villages to visit in the United States
Discover 10 idyllic villages in the USA, from California to Vermont. Explore their unique charm, rich history, stunning nature, and vibrant arts scenes.