Harbach Climate by Month
The temperature in Harbach can vary quite a bit throughout the year.
Temperatures can be warm during the warmest months,
and cold during the cooler months.
It maintains moderate precipitation patterns.
Let's now guide you through the climate details for a complete overview.
Average day and night temperature
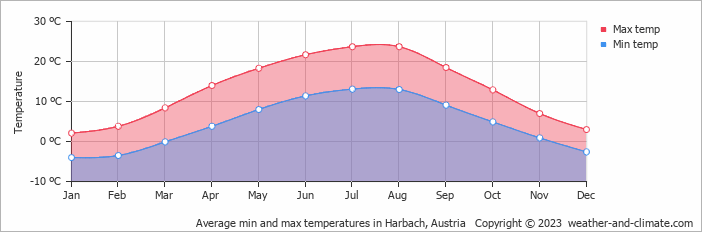
Visitors to Harbach can expect significant temperature changes throughout the year. Typically, daytime temperatures range from a comfortable 24°C in July to a chilly 2°C in the coolest month, January. Nights are cooler, with temperatures generally dropping to -4°C, particularly during the colder months.
The mean minimum and maximum temperatures throughout the year
Precipitation and rainy days
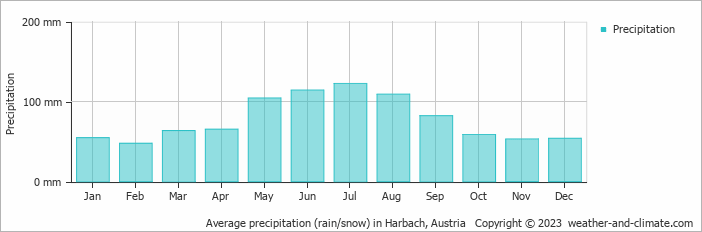
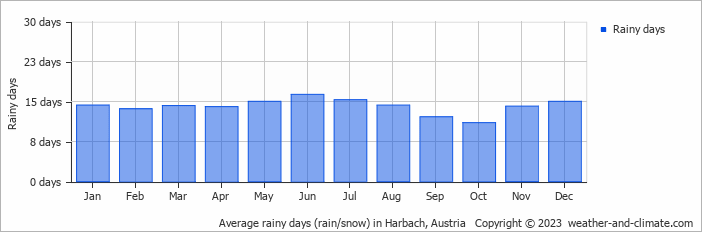
Generally, Harbach experiences moderate precipitation patterns, averaging 928 mm yearly. The climate in Harbach shows significant variation throughout the year. Expect high rainfall in July, with an average of 122 mm of precipitation over 15 rainy days. In contrast, February offers drier and sunnier days, with around 48 mm of snow/rainfall over 14 snowy/rainy days.The mean monthly precipitation over the year, including rain, hail and snow
The average number of days each month with precipitation
Sunshine over the year
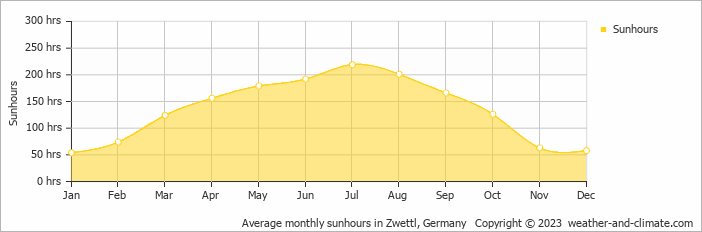
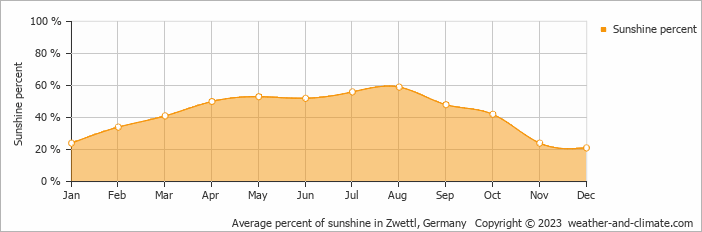
For those who appreciate different seasons, Harbach serves as an ideal destination. Expect longer, more sun-filled days in July with an average of 7.3 hours of sunshine daily, and embrace the darker days in January, offering only 1.8 hours of daily sunlight.Monthly hours of sunshine
Daily hours of sunshine
Daily percentage of sunshine
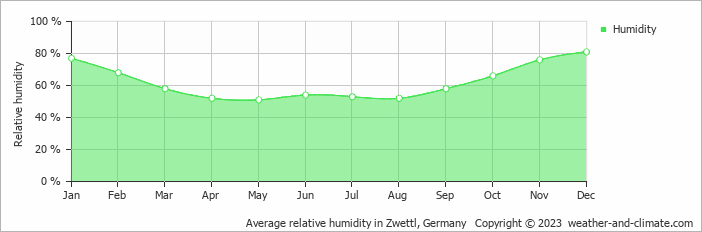
Average humidity
The relative humidity is low throughout the year in Harbach.
Relative humidity over the year
The best time of year to visit Harbach in Austria
During the months of June, July and August you are most likely to experience good weather with pleasant average temperatures that fall between 20°C and 26°C.Other facts from our historical weather data:
August has an average maximum temperature of 24°C and is the warmest month of the year.
The coldest month is January with an average maximum temperature of 2°C.
July tops the wettest month list with 122 mm of rainfall.
February is the driest month with 48 mm of precipitation.
July is the sunniest month with an average of 219 hours of sunshine.
No idea where to travel to this year? We have a tool that recommends destinations based on your ideal conditions. Find out where to go with our weather planner.