Gibson Bight Weather & Climate: Best Time to Visit
Average temperatures, rainfall, sunshine and the best time to visit Gibson Bight.
Climate overview of Gibson Bight
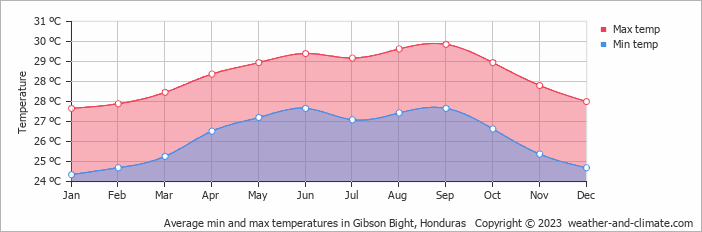
Gibson Bight, Honduras, has a stable climate with little temperature variation across the year. Average daytime temperatures hover around 29°C (84°F), peaking in September at 30°C (86°F) and dipping in January to 27°C (81°F).
With around 1533 mm (60 in) of annual rainfall, Gibson Bight has a notably wet climate. However, this rainfall is not evenly distributed — the city has a distinct rainy season from October to December. The wettest month is November. Sunshine peaks in April, when the city sees around 7.9 hours of sunshine per day.
Gibson Bight Weather by Month
Pick a month to see the average temperature, rainfall and sunshine in Gibson Bight — and find the best time to visit.
Monthly Temperature in Gibson Bight
With minimal seasonal shifts, Gibson Bight experiences a constant climate year-round. Average daytime temperatures reach a very warm 30°C (86°F) in September. In January, the coolest month of the year, temperatures drop to a comfortable 27°C (81°F).
At night, temperatures range from around 27°C (81°F) in September to 24°C (75°F) in January.
Check out our detailed temperature page for more information.
Temperature ranges by month
Rainfall in Gibson Bight
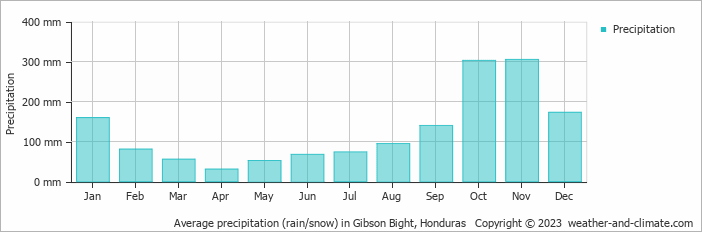
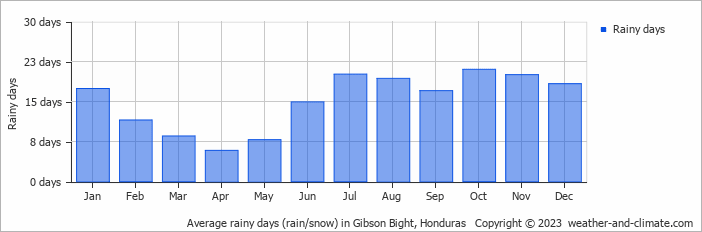
Gibson Bight has a notably wet climate with abundant precipitation, recording 1533 mm (60 in) of rainfall per year. Gibson Bight can be quite wet during November, receiving approximately 305 mm (12 in) of precipitation over 20 rainy days.
In contrast, during the driest month (April), you will experience much drier conditions, with 31 mm (1.2 in) of precipitation spread across 6 rainy days days. For more details, please visit our Gibson Bight Precipitation page.
The mean monthly precipitation over the year, including rain, hail, and snow
The average number of days each month with precipitation
Sunshine Hours in Gibson Bight
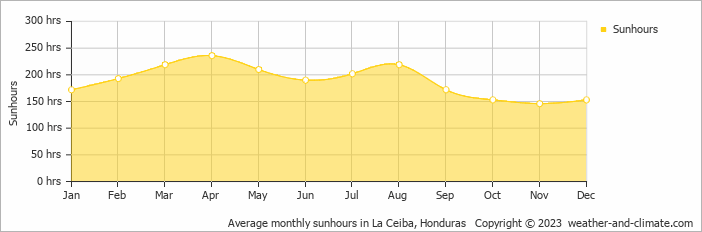
Gibson Bight experiences moderate variation in sunshine hours across the seasons. With 7.9 hours daily sunshine in April, it dips to 4.9 hours in November, offering a balanced mix of sunny and overcast days.
Visit our detailed sunshine hours page for more information.
Monthly hours of sunshine
Daily hours of sunshine
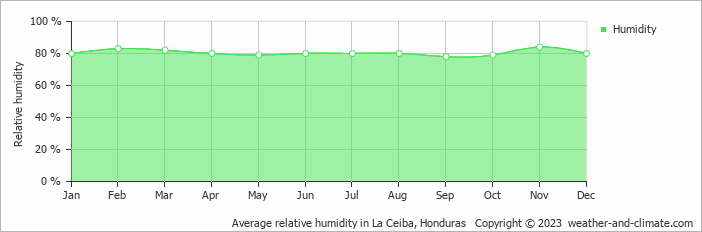
Humidity in Gibson Bight by Month
The city experiences its highest humidity in November, reaching 84%. In September, the humidity drops to its lowest level at 78%. What does this mean? Read our detailed page on humidity levels for further details.
Relative humidity over the year
Best Time to Visit Gibson Bight
It's smart to plan your activities during the cooler morning hours or take advantage of the refreshing evenings.
Note that October, November and December make up the rainy season, with heavier precipitation expected. Ready to plan your travels but need destination ideas? Our smart tool recommends places based on the climate conditions you prefer. Start planning with our destination weather tool.
Frequently asked questions about the climate in Gibson Bight
What is the best time to visit Gibson Bight?
February, March, April, May and July typically offer the most optimal weather in Gibson Bight. In contrast, October and November tend to have less optimal conditions. Gibson Bight has a distinct rainy season from October to December.
What temperatures can I expect in Gibson Bight?
Daytime highs range from 27°C (81°F) in January to 30°C (86°F) in September. Nighttime lows range from 24°C (75°F) to 27°C (81°F). Temperatures stay relatively stable year-round.
How much rain does Gibson Bight get?
Annual rainfall is around 1533 mm (60 in). November is the wettest month with 305 mm (12 in), while April is the driest with 31 mm (1.2 in).
How sunny is Gibson Bight?
Gibson Bight receives around 2,265 hours of sunshine per year. April is the sunniest month with 236 hours, while November is the cloudiest with just 146 hours. Overall, Gibson Bight enjoys abundant sunshine.
Gibson Bight 3-Day Forecast
Gibson Bight 3-Day Forecast
Gibson Bight on the map
Gibson Bight is highlighted — select any city to see its climate.
Popular this month
Where to go in July — average daytime high across popular destinations.
Bucket list
Need travel inspiration? Check out our bucket list articles and be inspired.
 Pico Bonito: Honduras' enchanting jungle adventure awaits
Explore Pico Bonito, Honduras' largest national park. Discover diverse wildlife, exhilarating activities, and lush landscapes. Your jungle adventure begins here!
 The top 5 unexplored rainforests in Central America
Dive into Central America's top 5 hidden rainforests for an unparalleled journey through vibrant wildlife and diverse landscapes.
The unspoiled Bahía Islands in Honduras
Discover Roatán, the largest of the Bahía Islands, a paradise for divers and snorkelers with stunning reefs and wildlife. Best visited February to July.