Fort Lee (NJ) Weather & Climate: Best Time to Visit
Average temperatures, rainfall, sunshine and the best time to visit Fort Lee.
Climate overview of Fort Lee
Fort Lee, New Jersey, United States of America, sees big temperature differences between seasons, with July peaking at 30°C (86°F) and February dropping to 4°C (39°F).
With around 1282 mm (50 in) of annual rain/snowfall, Fort Lee has a notably wet climate. The wettest month is June. The most sunshine falls in July, with an average of 9.0 hours of daily sunshine.
Fort Lee Weather by Month
Pick a month to see the average temperature, rainfall and sunshine in Fort Lee — and find the best time to visit.
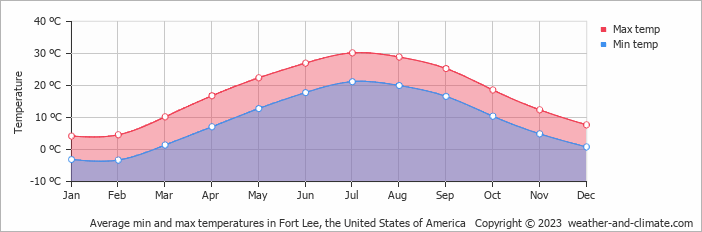
Monthly Temperature in Fort Lee
Visitors to Fort Lee can expect significant temperature changes throughout the year. Average daytime temperatures reach a very warm 30°C (86°F) in July. In February, the coolest month of the year, temperatures drop to a chilly 4°C (39°F).
At night, temperatures range from around 21°C (70°F) in July to -3°C (27°F) in February.
Check out our detailed temperature page for more information.
Temperature ranges by month
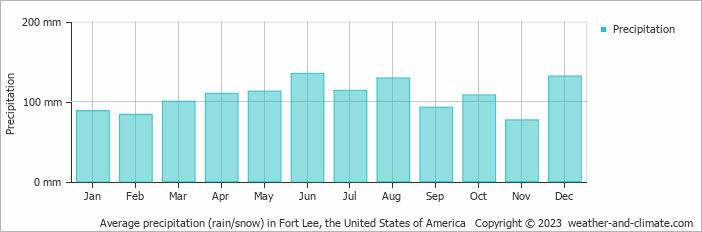
Rainfall in Fort Lee
Fort Lee is known for its substantial rain/snowfall, with annual precipitation reaching 1282 mm (50 in). Fort Lee experiences moderate seasonal variation in rainfall, with monthly averages ranging from 135 mm (5.3 in) in June, the wettest month, and 77 mm (3 in) in November, the driest month. For more details, please visit our Fort Lee Precipitation page.
The mean monthly precipitation over the year, including rain, hail, and snow
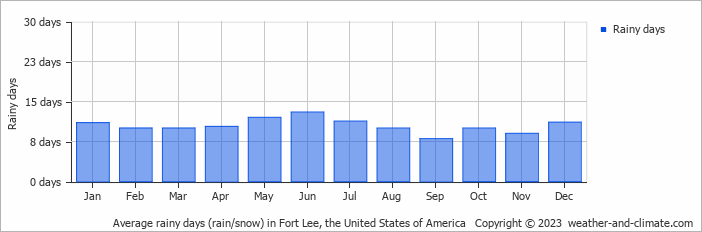
The average number of days each month with precipitation
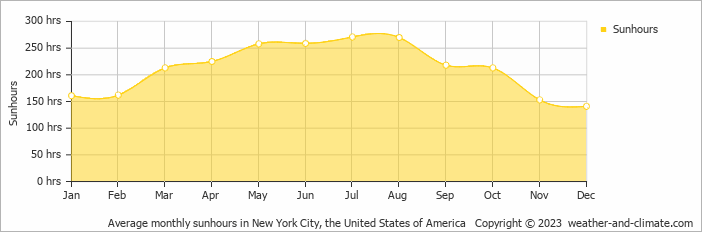
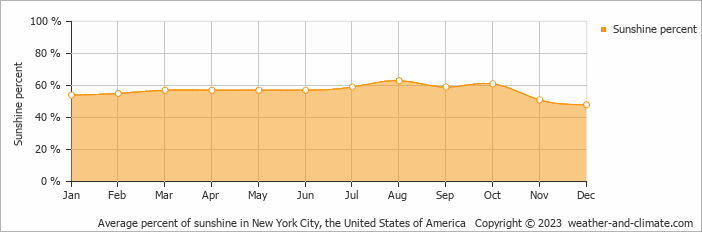
Sunshine Hours in Fort Lee
Fort Lee can be enjoyed more throughout the sunniest month of July under a blue sky, with approximately 9.0 hours of sunshine daily. In contrast, the city experiences much darker days in December, with only 4.7 hours of sunlight per day.
Visit our detailed sunshine hours page for more information.
Monthly hours of sunshine
Daily hours of sunshine
Daily percentage of sunshine
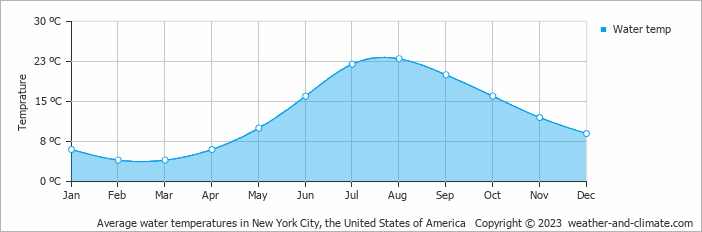
Water Temperature in Fort Lee
The mean water temperature over the year ranges from 4°C (39°F) in February to 23°C (73°F) in August.
Water temperature over the year
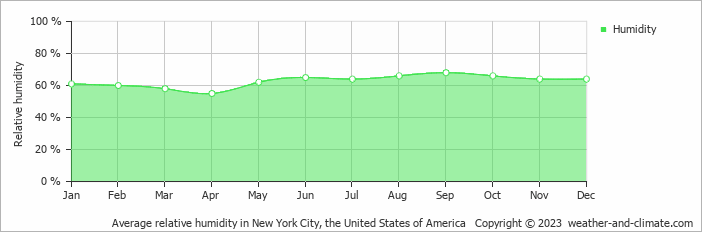
Humidity in Fort Lee by Month
The relative humidity is high throughout the year in Fort Lee.
The city experiences its highest humidity in September, reaching 68%. In April, the humidity drops to its lowest level at 55%. What does this mean? Read our detailed page on humidity levels for further details.
Relative humidity over the year
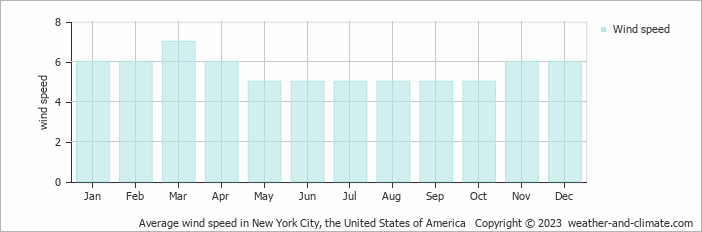
Wind Speed in Fort Lee
The mean wind speed over the year ranges from 5 m/s (10 knots) in May, June, July, August, September and October to 7 m/s (14 knots) in March. What does this mean?
The mean monthly wind speed over the year (meters per second)
Best Time to Visit Fort Lee
The weather does bring rainfall during this period, between 93 mm (3.7 in) and 135 mm (5.3 in). Wondering where to travel based on your weather preferences? Our recommendation tool helps you find destinations with your ideal climate conditions. Use our weather planner to find your perfect destination.
Frequently asked questions about the climate in Fort Lee
What is the best time to visit Fort Lee?
September typically offers the most optimal weather in Fort Lee. In contrast, January, February, March and December tend to have less optimal conditions.
What temperatures can I expect in Fort Lee?
Daytime highs range from 4°C (39°F) in February to 30°C (86°F) in July. Nighttime lows range from -3°C (27°F) to 21°C (70°F). Temperatures vary considerably through the year.
How much rain does Fort Lee get?
Annual rainfall is around 1282 mm (50 in). June is the wettest month with 135 mm (5.3 in), while November is the driest with 77 mm (3 in).
How sunny is Fort Lee?
Fort Lee receives around 2,544 hours of sunshine per year. July is the sunniest month with 271 hours, while December is the cloudiest with just 141 hours. Overall, Fort Lee enjoys abundant sunshine.
Fort Lee 3-Day Forecast
Fort Lee (NJ) 3-Day Forecast
Fort Lee on the map
Fort Lee is highlighted — select any city to see its climate.
Popular this month
Where to go in July — average daytime high across popular destinations.
Bucket list
Need travel inspiration? Check out our bucket list articles and be inspired.
 Yosemite National Park is definitely worth a visit
Vast forests, blue lakes, towering sequoias, and majestic waterfalls hint at the beauty of Yosemite National Park—a true natural masterpiece.
The 10 most alternative cities in the United States
Discover the top 10 fun and alternative U.S. cities rich in art, culture, and adventure. From Portland's hippy charm to Sedona's stunning landscapes.
Sedona: Explore Majestic Red Rock Landscapes
A picturesque artists' town surrounded by red rocks and known for its spirituality, vortex energy, and stunning hikes like Cathedral Rock.
10 most idyllic villages to visit in the United States
Discover 10 idyllic villages in the USA, from California to Vermont. Explore their unique charm, rich history, stunning nature, and vibrant arts scenes.