Caidian Weather & Climate: Best Time to Visit
Average temperatures, rainfall, sunshine and the best time to visit Caidian.
Climate overview of Caidian
The climate in Caidian, China, is marked by large temperature swings across the seasons, ranging from 34°C (93°F) in July to 9°C (48°F) in January.
The city has a wet climate, receiving around 1543 mm (61 in) of rain/snowfall per year. Despite the high annual total, it has a distinct rainy season from May to July. June is the wettest month. Sunshine peaks in August, when the city sees around 7.5 hours of sunshine per day.
Caidian Weather by Month
Pick a month to see the average temperature, rainfall and sunshine in Caidian — and find the best time to visit.
Monthly Temperature in Caidian
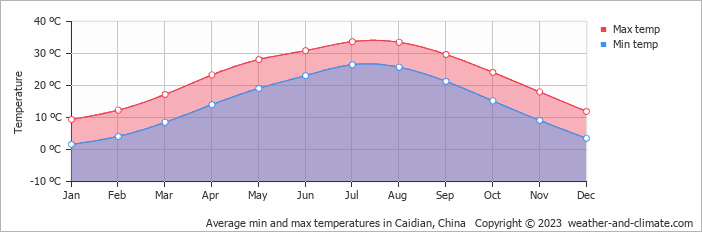
In Caidian, temperatures differ significantly between summer and winter months. On average, daytime temperatures range from a very warm 34°C (93°F) in July to a chilly 9°C (48°F) in January.
Nighttime temperatures range from 27°C (81°F) in July to 2°C (36°F) in January.
Check out our detailed temperature page for more information.
Temperature ranges by month
Rainfall in Caidian
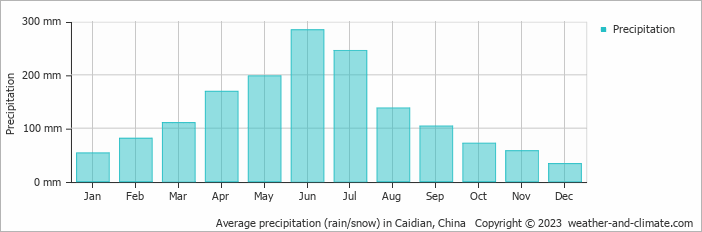
Caidian experiences significant rain/snowfall throughout the year, averaging 1543 mm (61 in) of precipitation annually. The seasons in Caidian bring significant changes in precipitation. The wettest month, June, receives heavy rainfall, with an average of 284 mm (11 in) of precipitation. This rainfall is distributed across 12 rainy days.
In contrast, the driest month, December, experiences much less rainfall, totaling 33 mm (1.3 in) over 11 rainy days. These distinct seasonal differences provide diverse experiences throughout the year. For more details, please visit our Caidian Precipitation page.
The mean monthly precipitation over the year, including rain, hail, and snow
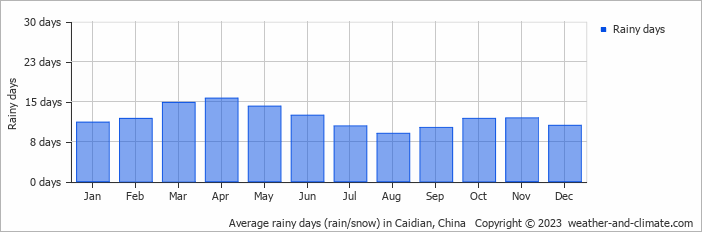
The average number of days each month with precipitation
Sunshine Hours in Caidian
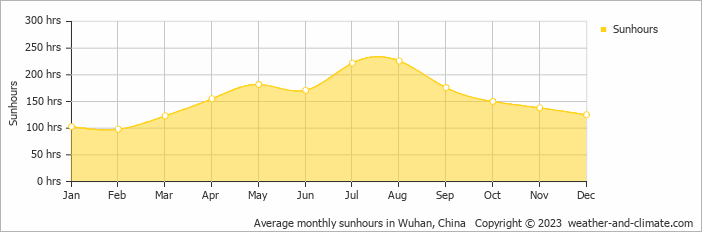
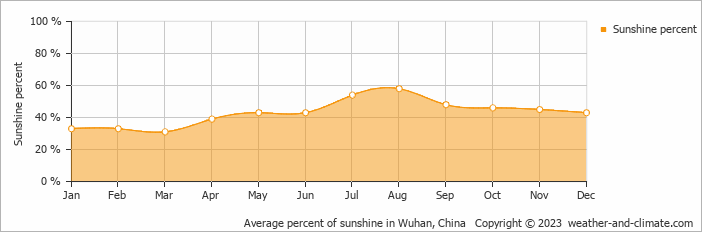
In Caidian, summer days are longer and more sunny, with daily sunshine hours peaking at 7.5 hours in August. As the darker season arrives, the brightness of the sun becomes less. February sees a soft sun for only 3.3 hours per average day.
Visit our detailed sunshine hours page for more information.
Monthly hours of sunshine
Daily hours of sunshine
Daily percentage of sunshine
Humidity in Caidian by Month
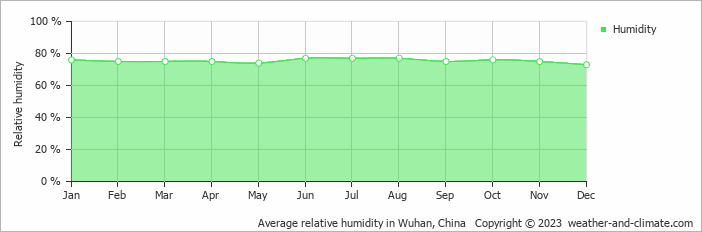
The relative humidity is high throughout the year in Caidian.
The city experiences its highest humidity in June, reaching 77%. In December, the humidity drops to its lowest level at 73%. What does this mean? Read our detailed page on humidity levels for further details.
Relative humidity over the year
Wind Speed in Caidian
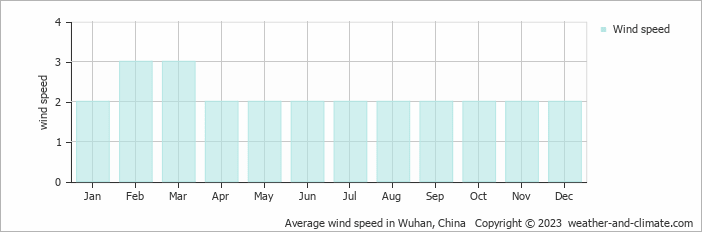
The mean wind speed over the year ranges from 2 m/s (4 knots) in January, April, May, June, July, August, September, October, November and December to 3 m/s (6 knots) in February and March. What does this mean?
The mean monthly wind speed over the year (meters per second)
Best Time to Visit Caidian
Be prepared for heavier rainfall during April, May, June and July, the wettest period of the year. Need help choosing your next travel destination? We offer a specialized tool that matches you with locations based on your weather preferences. Explore destinations that suit your climate preferences.
Frequently asked questions about the climate in Caidian
What is the best time to visit Caidian?
October typically offers the most optimal weather in Caidian. In contrast, January, June, July and August tend to have less optimal conditions. Caidian has a distinct rainy season from May to July.
What temperatures can I expect in Caidian?
Daytime highs range from 9°C (48°F) in January to 34°C (93°F) in July. Nighttime lows range from 2°C (36°F) to 27°C (81°F). Temperatures vary considerably through the year.
How much rain does Caidian get?
Annual rainfall is around 1543 mm (61 in). June is the wettest month with 284 mm (11 in), while December is the driest with 33 mm (1.3 in).
How sunny is Caidian?
Caidian receives around 1,869 hours of sunshine per year. August is the sunniest month with 226 hours, while February is the cloudiest with just 98 hours.
Caidian 3-Day Forecast
Caidian 3-Day Forecast
Caidian on the map
Caidian is highlighted — select any city to see its climate.
Popular this month
Where to go in July — average daytime high across popular destinations.
Bucket list
Need travel inspiration? Check out our bucket list articles and be inspired.
 The Li River: A Journey Through China’s Most Breathtaking Landscape
Explore the Li River, China's breathtaking landscape with majestic mountains, serene waters, and picturesque views. A must-see for every traveler.
Go to China's Zhangjiajie National Park with the highest, the fastest, largest-loaded outdoor elevator in the world
You won't find this unique landscape anywhere else in the world. Thousands of floating mountains overgrown with trees at the top dominate this fairy tale landscape.
Go to Xinjiang in China
In Xinjiang you get to see a mix of East and Central Asia. An experience that you might want to add to your bucket list. You can travel through the province as if you are following an ancient silk route.
Mount Kailash
The best time for a Kailash tour/trekking is from mid-May to mid-October when the temperature is most pleasant. It is warm, dry and sunny in that period.