Aventura (FL) Weather & Climate: Best Time to Visit
Average temperatures, rainfall, sunshine and the best time to visit Aventura.
Climate overview of Aventura
The climate in Aventura, Florida, United States of America, sees a moderate range of temperatures across the year, from 32°C (90°F) in August down to 24°C (75°F) in January.
The city receives considerable rainfall, with around 1578 mm (62 in) annually. September is the wettest month. It has a distinct rainy season from June to September. July is the sunniest month, averaging 10.3 hours of sunshine per day.
Aventura Weather by Month
Pick a month to see the average temperature, rainfall and sunshine in Aventura - and find the best time to visit.
Monthly Temperature in Aventura
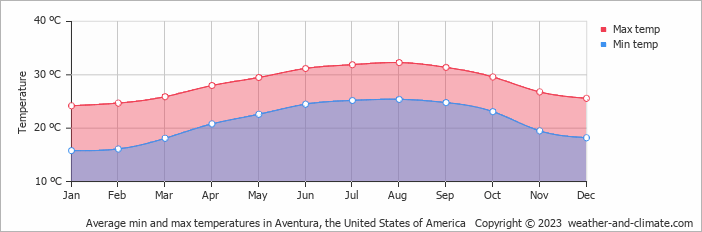
The climate in Aventura experiences moderate temperature changes, with mild shifts between seasons. Typically, average maximum daytime temperatures range from a very warm 32°C (90°F) in August to a comfortable 24°C (75°F) in the coolest month, January.
Nights vary from 25°C (77°F) in August to around 16°C (61°F) during the colder months.
Check out our detailed temperature page for more information.
Temperature ranges by month
Rainfall in Aventura
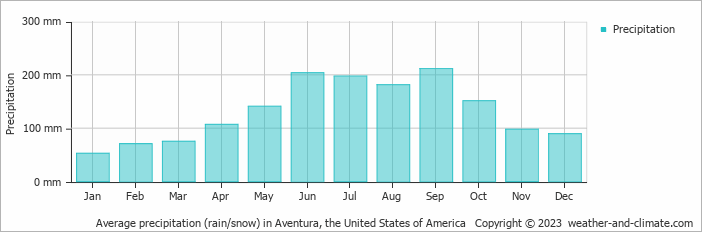
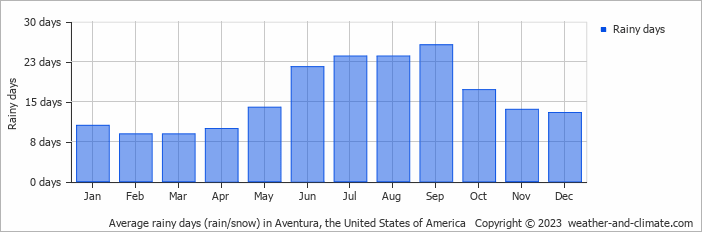
Aventura experiences significant rainfall throughout the year, averaging 1578 mm (62 in) of precipitation annually. The climate in Aventura shows significant variation throughout the year. Expect heavy rainfall in September, the wettest month, with an average of 211 mm (8.3 in) of precipitation over 26 rainy days.
In contrast, the driest month January offers drier and sunnier days, with around 53 mm (2.1 in) of rainfall over 11 rainy days. For more details, please visit our Aventura Precipitation page.
The mean monthly precipitation over the year, including rain, hail, and snow
The average number of days each month with precipitation
Sunshine Hours in Aventura
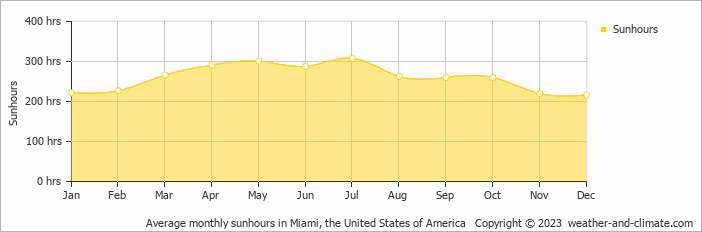
Aventura offers a pleasant mix of sunny and slightly overcast days. The difference in sunshine hours between July (10.3 hours daily) and December (7.2 hours daily) provides a bit of variety for visitors and residents.
Visit our detailed sunshine hours page for more information.
Monthly hours of sunshine
Daily hours of sunshine
Daily percentage of sunshine
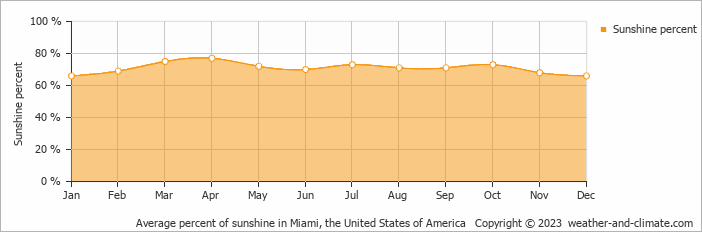
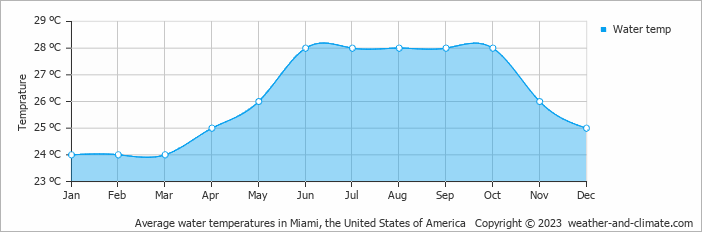
Water Temperature in Aventura
The mean water temperature over the year ranges from 24°C (75°F) in January to 28°C (82°F) in June.
Water temperature over the year
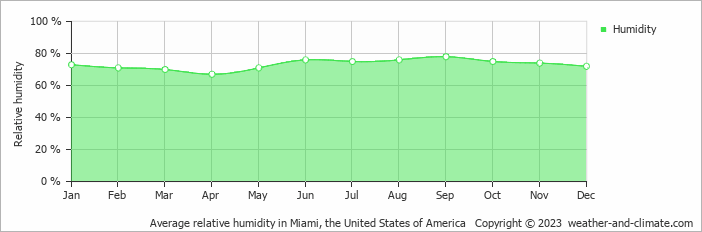
Humidity in Aventura by Month
The relative humidity is high throughout the year in Aventura.
The city experiences its highest humidity in September, reaching 78%. In April, the humidity drops to its lowest level at 67%. What does this mean? Read our detailed page on humidity levels for further details.
Relative humidity over the year
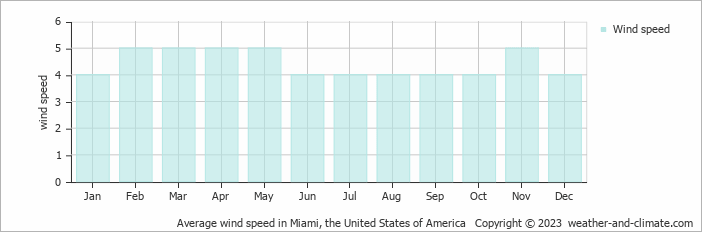
Wind Speed in Aventura
The mean wind speed over the year ranges from 4 m/s (8 knots) in January, June, July, August, September, October and December to 5 m/s (10 knots) in February, March, April, May and November. What does this mean?
The mean monthly wind speed over the year (meters per second)
Best Time to Visit Aventura
Monthly ratings reflect general weather comfort, based on daytime temperature and rainfall. Swimming and winter conditions are highlighted separately where relevant.
- Best overall: January, February, March, November and December
- Warmest weather: June, July, August and September
- Most sunshine: May and July
- Fewest rainy days: January, February, March and April
- Best for swimming: Any time of year. The sea stays pleasantly warm year-round.
- Seasonal pattern: A distinct rainy season from June to September
Frequently asked questions about the climate in Aventura
What is the best time to visit Aventura?
January, February, March, November and December typically offer the most optimal weather in Aventura. In contrast, June, July, August and September tend to have less optimal conditions. Aventura has a distinct rainy season from June to September.
What temperatures can I expect in Aventura?
Daytime highs range from 24°C (75°F) in January to 32°C (90°F) in August. Nighttime lows range from 16°C (61°F) to 25°C (77°F).
How much rain does Aventura get?
Annual rainfall is around 1578 mm (62 in). September is the wettest month with 211 mm (8.3 in), while January is the driest with 53 mm (2.1 in).
How sunny is Aventura?
Aventura receives around 3,122 hours of sunshine per year. July is the sunniest month with 308 hours, while December is the cloudiest with just 216 hours. Overall, Aventura enjoys abundant sunshine.
Aventura 3-Day Forecast
Aventura (FL) 3-Day Forecast
Aventura on the map
Aventura is highlighted - select any city to see its climate.
Popular this month
Where to go in July - average daytime high across popular destinations.
Bucket list
Need travel inspiration? Check out our bucket list articles and be inspired.
 Yosemite National Park is definitely worth a visit
Vast forests, blue lakes, towering sequoias, and majestic waterfalls hint at the beauty of Yosemite National Park—a true natural masterpiece.
The 10 most alternative cities in the United States
Discover the top 10 fun and alternative U.S. cities rich in art, culture, and adventure. From Portland's hippy charm to Sedona's stunning landscapes.
Sedona: Explore Majestic Red Rock Landscapes
A picturesque artists' town surrounded by red rocks and known for its spirituality, vortex energy, and stunning hikes like Cathedral Rock.
10 most idyllic villages to visit in the United States
Discover 10 idyllic villages in the USA, from California to Vermont. Explore their unique charm, rich history, stunning nature, and vibrant arts scenes.