Tauranga Weather & Climate: Best Time to Visit
Average temperatures, rainfall, sunshine and the best time to visit Tauranga.
Climate overview of Tauranga
Tauranga, Bay of Plenty, New Zealand, experiences moderate temperature changes through the seasons. February is the warmest month with daytime highs of 23°C (73°F), while July is the coolest at 15°C (59°F).
Rainfall is high, totalling around 1383 mm (54 in) per year. July is the wettest month and January the driest. The sunniest month is January, with 8.7 hours of sunshine per day on average.
Tauranga Weather by Month
Pick a month to see the average temperature, rainfall and sunshine in Tauranga — and find the best time to visit.
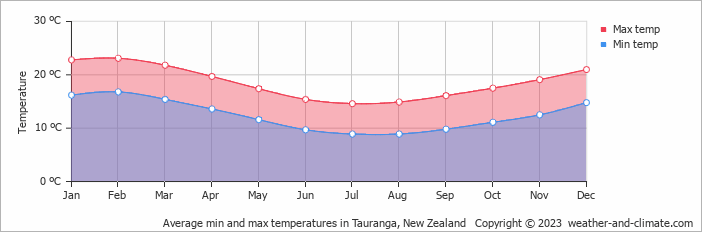
Monthly Temperature in Tauranga
The climate in Tauranga experiences moderate temperature changes, with mild shifts between seasons. Average maximum daytime temperatures range from a comfortable 23°C (73°F) in February, the warmest time of the year, to a moderate 15°C (59°F) during cooler months like July.
At night, you can expect temperatures ranging from 17°C (63°F) in February to around 9°C (48°F) during July.
Check out our detailed temperature page for more information.
Temperature ranges by month
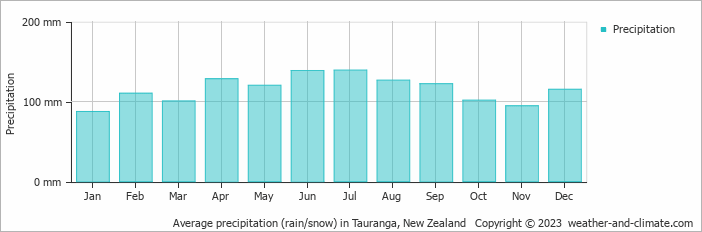
Rainfall in Tauranga
Tauranga has a relatively rainy climate with high precipitation levels, averaging 1383 mm (54 in) of rainfall annually. Year-round, Tauranga has a balanced climate with minimal variation in precipitation. The difference between the wettest month, July, with 139 mm (5.5 in), and the driest month, January, with 87 mm (3.4 in), is minimal. For more details, please visit our Tauranga Precipitation page.
The mean monthly precipitation over the year, including rain, hail, and snow
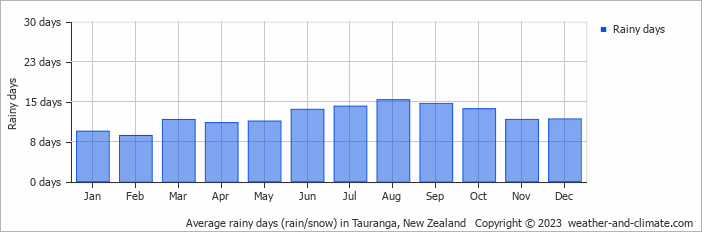
The average number of days each month with precipitation
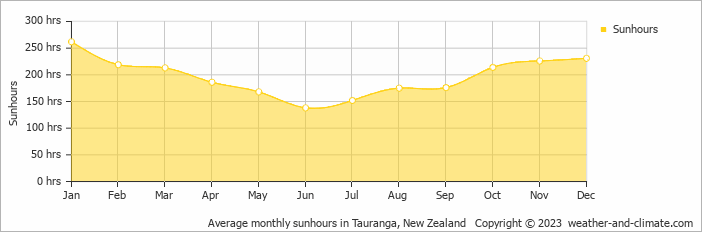
Sunshine Hours in Tauranga
Seasonal changes in sunshine hours are quite dramatic in Tauranga. While January receives considerable daily sunshine with up to 8.7 hours, June marks the darkest time of the year, where sunshine is scarce with only 4.6 hours of sunlight per day.
Visit our detailed sunshine hours page for more information.
Monthly hours of sunshine
Daily hours of sunshine
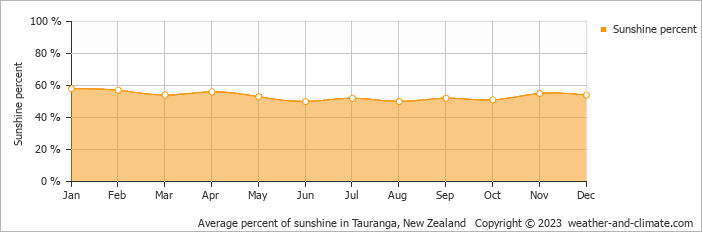
Daily percentage of sunshine
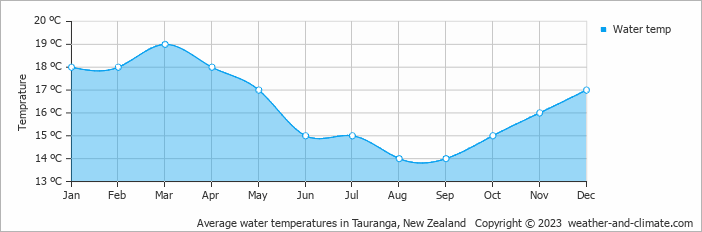
Water Temperature in Tauranga
The mean water temperature over the year ranges from 14°C (57°F) in August to 19°C (66°F) in March.
Water temperature over the year
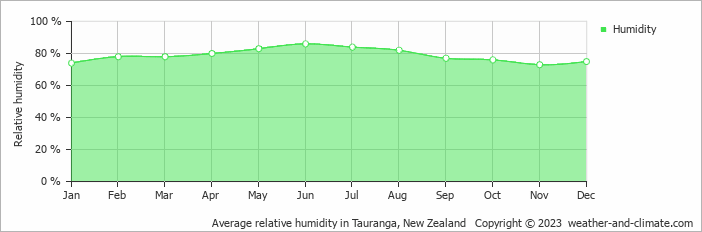
Humidity in Tauranga by Month
The relative humidity is high throughout the year in Tauranga.
The city experiences its highest humidity in June, reaching 86%. In November, the humidity drops to its lowest level at 73%. What does this mean? Read our detailed page on humidity levels for further details.
Relative humidity over the year
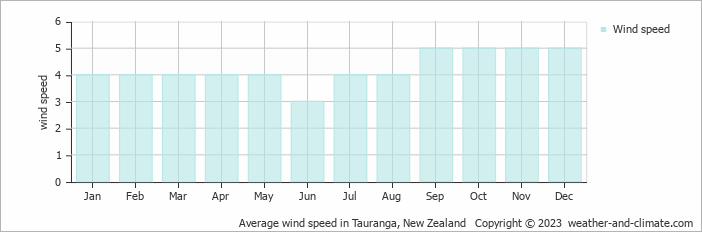
Wind Speed in Tauranga
The mean wind speed over the year ranges from 3 m/s (6 knots) in June to 5 m/s (10 knots) in September, October, November and December. What does this mean?
The mean monthly wind speed over the year (meters per second)
Best Time to Visit Tauranga
Rainfall during this time ranges from 87 mm (3.4 in) in January to 128 mm (5 in) in April. This means you can expect a mix of sunny days and occasional showers. Need help choosing your next travel destination? We offer a specialized tool that matches you with locations based on your weather preferences. Explore destinations that suit your climate preferences.
Frequently asked questions about the climate in Tauranga
What is the best time to visit Tauranga?
January typically offers the most optimal weather in Tauranga. In contrast, May, June, July, August and September tend to have less optimal conditions.
What temperatures can I expect in Tauranga?
Daytime highs range from 15°C (59°F) in July to 23°C (73°F) in February. Nighttime lows range from 9°C (48°F) to 17°C (63°F).
How much rain does Tauranga get?
Annual rainfall is around 1383 mm (54 in). July is the wettest month with 139 mm (5.5 in), while January is the driest with 87 mm (3.4 in).
How sunny is Tauranga?
Tauranga receives around 2,360 hours of sunshine per year. January is the sunniest month with 262 hours, while June is the cloudiest with just 138 hours. Overall, Tauranga enjoys abundant sunshine.
Tauranga 3-Day Forecast
Tauranga 3-Day Forecast
Tauranga on the map
Tauranga is highlighted — select any city to see its climate.
Popular this month
Where to go in July — average daytime high across popular destinations.
Bucket list
Need travel inspiration? Check out our bucket list articles and be inspired.
 The Tongariro Crossing in New Zealand
It is called the most beautiful walk in New Zealand, the Tongariro Crossing. The official hiking season starts late October until end of April.
White-water sledge and raft in Rotorua
We recommend to white-water sledge and raft in Rotorua in summer (January, February) when the Glacier melt fills the rivers. This is the best time.