Clayton (NM) Weather & Climate: Best Time to Visit
Average temperatures, rainfall, sunshine and the best time to visit Clayton.
Climate overview of Clayton
The climate in Clayton, New Mexico, United States of America, is marked by large temperature swings across the seasons, ranging from 32°C (90°F) in July to 9°C (48°F) in January.
With around 408 mm (16 in) of annual rain/snowfall, Clayton has a fairly dry climate. However, it has a distinct dry season from October to April. The wettest month is July, while January sees the least rain.
Clayton Weather by Month
Pick a month to see the average temperature, rainfall and sunshine in Clayton — and find the best time to visit.
Monthly Temperature in Clayton
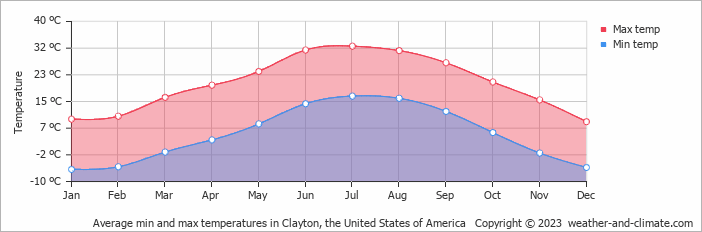
In Clayton, temperatures differ significantly between summer and winter months. Average daytime temperatures reach a very warm 32°C (90°F) in July. In January, the coolest month of the year, temperatures drop to a chilly 9°C (48°F).
At night, temperatures range from around 17°C (63°F) in July to -6°C (21°F) in January.
Check out our detailed temperature page for more information.
Temperature ranges by month
Rainfall in Clayton
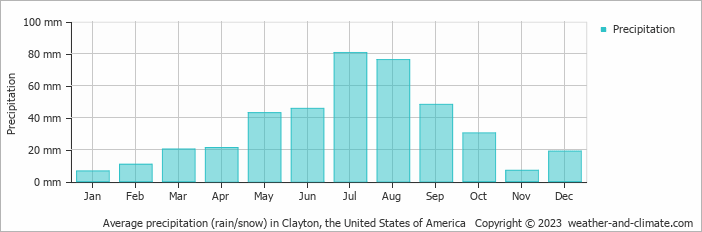
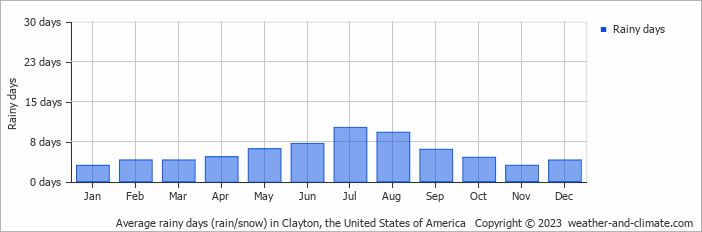
Clayton tends toward drier weather patterns, receiving approximately 408 mm (16 in) of rain/snow per year. Clayton can be quite wet during July, receiving approximately 81 mm (3.2 in) of precipitation over 10 rainy days.
In contrast, during the driest month (January), you will experience much drier conditions, with 6.5 mm (0.3 in) of precipitation spread across 3 rainy days days. For more details, please visit our Clayton Precipitation page.
The mean monthly precipitation over the year, including rain, hail, and snow
The average number of days each month with precipitation
Humidity in Clayton by Month
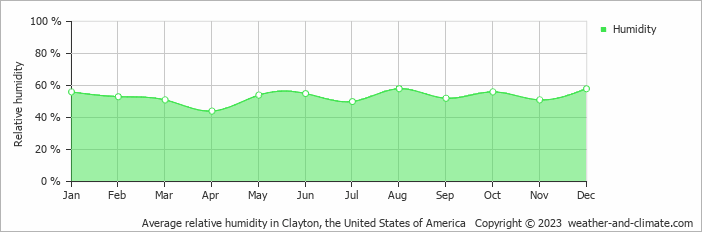
The relative humidity is moderate throughout the year in Clayton.
The city experiences its highest humidity in August, reaching 58%. In April, the humidity drops to its lowest level at 44%. What does this mean? Read our detailed page on humidity levels for further details.
Relative humidity over the year
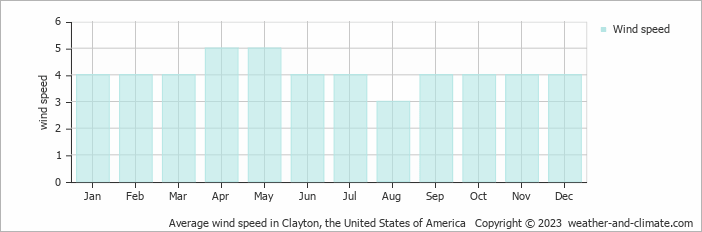
Wind Speed in Clayton
The mean wind speed over the year ranges from 3 m/s (6 knots) in August to 5 m/s (10 knots) in April and May. What does this mean?
The mean monthly wind speed over the year (meters per second)
Best Time to Visit Clayton
Frequently asked questions about the climate in Clayton
What is the best time to visit Clayton?
April, May, September and October typically offer the most optimal weather in Clayton. In contrast, January, February and December tend to have less optimal conditions. Clayton has a distinct dry season from October to April.
What temperatures can I expect in Clayton?
Daytime highs range from 9°C (48°F) in January to 32°C (90°F) in July. Nighttime lows range from -6°C (21°F) to 17°C (63°F). Temperatures vary considerably through the year.
How much rain does Clayton get?
Annual rainfall is around 408 mm (16 in). July is the wettest month with 81 mm (3.2 in), while January is the driest with 6.5 mm (0.3 in).
Clayton 3-Day Forecast
Clayton (NM) 3-Day Forecast
Clayton on the map
Clayton is highlighted — select any city to see its climate.
Popular this month
Where to go in July — average daytime high across popular destinations.
Bucket list
Need travel inspiration? Check out our bucket list articles and be inspired.
 Yosemite National Park is definitely worth a visit
Vast forests, blue lakes, towering sequoias, and majestic waterfalls hint at the beauty of Yosemite National Park—a true natural masterpiece.
The 10 most alternative cities in the United States
Discover the top 10 fun and alternative U.S. cities rich in art, culture, and adventure. From Portland's hippy charm to Sedona's stunning landscapes.
Sedona: Explore Majestic Red Rock Landscapes
A picturesque artists' town surrounded by red rocks and known for its spirituality, vortex energy, and stunning hikes like Cathedral Rock.
10 most idyllic villages to visit in the United States
Discover 10 idyllic villages in the USA, from California to Vermont. Explore their unique charm, rich history, stunning nature, and vibrant arts scenes.