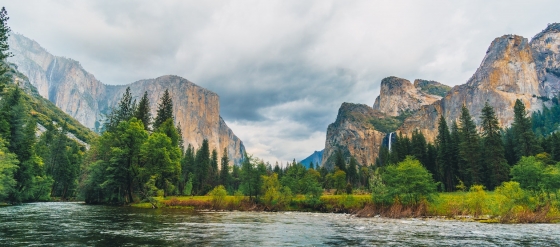
 Yosemite National Park is definitely worth a visit
Vast forests, blue lakes, towering sequoias, and majestic waterfalls hint at the beauty of Yosemite National Park—a true natural masterpiece.
Oregon is a region in the United States of America. Many people wonder what the weather conditions are in Oregon over the year. What is the best time to visit Oregon?
This page shows the average weather conditions by month in Oregon over the year in: January, February, March, April, May, June, July, August, September, October, November, December.
In January the weather in Oregon is generally less favorable. January is a winter month. The temperatures range from very low in Wallowa Lake with 1°C (34°F) to moderate in Brookings with 13°C (55°F).
Find more detailed climate information for Oregon in January here.
Perfect weather is subjective. On this map perfect weather has been defined with temperatures between 20°C (68°F) and 29°C (84°F) and not too much precipitation (less than 90 mm (3.5 in) a month).
In February the weather in Oregon ranges from less favorable in Seaside to mixed in Portland. February is a winter month. The temperatures range from low in Wallowa Lake with 3°C (37°F) to moderate in Brookings with 13°C (55°F).
Find more detailed climate information for Oregon in February here.
Perfect weather is subjective. On this map perfect weather has been defined with temperatures between 20°C (68°F) and 29°C (84°F) and not too much precipitation (less than 90 mm (3.5 in) a month).
In March the weather in Oregon ranges from less favorable in Portland to mixed in The Dalles. The temperatures range from low in Wallowa Lake with 6°C (43°F) to moderate in Central Point with 15°C (59°F).
Find more detailed climate information for Oregon in March here.
Perfect weather is subjective. On this map perfect weather has been defined with temperatures between 20°C (68°F) and 29°C (84°F) and not too much precipitation (less than 90 mm (3.5 in) a month).
In April the weather in Oregon ranges from less favorable in Seaside to very good in The Dalles. The temperatures range from low in Willamette National Forest with 10°C (50°F) to pleasant in Boardman with 19°C (66°F).
Find more detailed climate information for Oregon in April here.
Perfect weather is subjective. On this map perfect weather has been defined with temperatures between 20°C (68°F) and 29°C (84°F) and not too much precipitation (less than 90 mm (3.5 in) a month).
In May the weather in Oregon ranges from mixed in Seaside to excellent in Portland. The temperatures range from moderate in Willamette National Forest with 14°C (57°F) to high in Boardman with 24°C (75°F).
Find more detailed climate information for Oregon in May here.
Perfect weather is subjective. On this map perfect weather has been defined with temperatures between 20°C (68°F) and 29°C (84°F) and not too much precipitation (less than 90 mm (3.5 in) a month).
Perfect weather is subjective. On this map perfect weather has been defined with temperatures between 20°C (68°F) and 29°C (84°F) and not too much precipitation (less than 90 mm (3.5 in) a month).
Perfect weather is subjective. On this map perfect weather has been defined with temperatures between 20°C (68°F) and 29°C (84°F) and not too much precipitation (less than 90 mm (3.5 in) a month).
In August the weather in Oregon is generally excellent. August is a summer month. The temperatures range from moderate in Newport with 18°C (64°F) to very high in Ontario with 33°C (91°F). On average, this month is one of the warmest months of the year in Oregon. So be prepared and make sure to dress lightly.
Find more detailed climate information for Oregon in August here.
Perfect weather is subjective. On this map perfect weather has been defined with temperatures between 20°C (68°F) and 29°C (84°F) and not too much precipitation (less than 90 mm (3.5 in) a month).
In September the weather in Oregon ranges from very good in Depoe Bay to excellent in Portland. September is a summer month. The temperatures range from moderate in Newport with 18°C (64°F) to high in Central Point with 29°C (84°F).
Find more detailed climate information for Oregon in September here.
Perfect weather is subjective. On this map perfect weather has been defined with temperatures between 20°C (68°F) and 29°C (84°F) and not too much precipitation (less than 90 mm (3.5 in) a month).
In October the weather in Oregon ranges from less favorable in Seaside to excellent in The Dalles. The temperatures range from moderate in Wallowa Lake with 13°C (55°F) to pleasant in Central Point with 21°C (70°F).
Find more detailed climate information for Oregon in October here.
Perfect weather is subjective. On this map perfect weather has been defined with temperatures between 20°C (68°F) and 29°C (84°F) and not too much precipitation (less than 90 mm (3.5 in) a month).
In November the weather in Oregon is generally less favorable. The temperatures range from low in Wallowa Lake with 5°C (41°F) to moderate in Brookings with 14°C (57°F).
Find more detailed climate information for Oregon in November here.
Perfect weather is subjective. On this map perfect weather has been defined with temperatures between 20°C (68°F) and 29°C (84°F) and not too much precipitation (less than 90 mm (3.5 in) a month).
In December the weather in Oregon is generally less favorable. December is a winter month. The temperatures range from very low in Wallowa Lake with 0°C (32°F) to low in Brookings with 12°C (54°F). On average, this month is the coldest month of the year in Oregon.
Find more detailed climate information for Oregon in December here.
Perfect weather is subjective. On this map perfect weather has been defined with temperatures between 20°C (68°F) and 29°C (84°F) and not too much precipitation (less than 90 mm (3.5 in) a month).
More climate information for the top 5 destinations in Oregon:
Need travel inspiration? Check out our bucket list articles and be inspired.
Yosemite National Park is definitely worth a visit
Vast forests, blue lakes, towering sequoias, and majestic waterfalls hint at the beauty of Yosemite National Park—a true natural masterpiece.
 The 10 most alternative cities in the United States
Discover the top 10 fun and alternative U.S. cities rich in art, culture, and adventure. From Portland's hippy charm to Sedona's stunning landscapes.
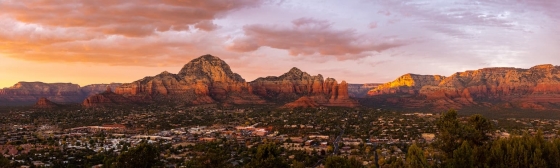 Sedona: Explore Majestic Red Rock Landscapes
A picturesque artists' town surrounded by red rocks and known for its spirituality, vortex energy, and stunning hikes like Cathedral Rock.
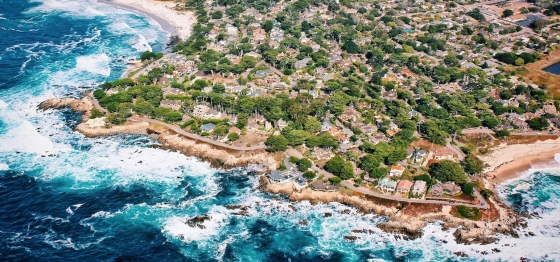 10 most idyllic villages to visit in the United States
Discover 10 idyllic villages in the USA, from California to Vermont. Explore their unique charm, rich history, stunning nature, and vibrant arts scenes.