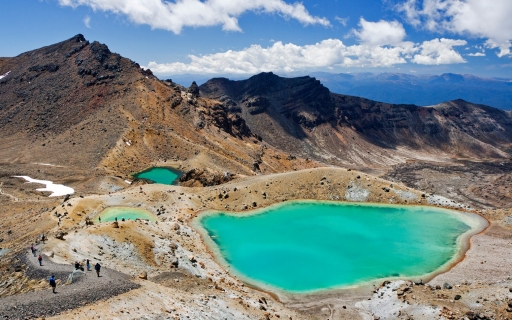
 The Tongariro Crossing in New Zealand
It is called the most beautiful walk in New Zealand, the Tongariro Crossing. The official hiking season starts late October until end of April.
Wellington is a region in New Zealand. Many people wonder what the weather conditions are in Wellington over the year. What is the best time to visit Wellington?
This page shows the average weather conditions by month in Wellington over the year in: January, February, March, April, May, June, July, August, September, October, November, December.
In January the weather in Wellington ranges from good in Paraparaumu Beach to excellent in Martinborough. The average maximum daytime temperatures are pleasant and range from 19°C (66°F) in Wellington to 21°C (70°F) in Masterton.
Find more detailed climate information for Wellington in January here.
Perfect weather is subjective. On this map perfect weather has been defined with temperatures between 20°C (68°F) and 29°C (84°F) and not too much precipitation (less than 90 mm (3.5 in) a month).
In February the weather in Wellington ranges from very good in Wellington to excellent in Lower Hutt. The average maximum daytime temperatures are pleasant and range from 19°C (66°F) in Wellington to 22°C (72°F) in Masterton. On average, this month is the warmest month of the year in Wellington.
Find more detailed climate information for Wellington in February here.
Perfect weather is subjective. On this map perfect weather has been defined with temperatures between 20°C (68°F) and 29°C (84°F) and not too much precipitation (less than 90 mm (3.5 in) a month).
In March the weather in Wellington ranges from good in Otaki to excellent in Martinborough. In Wellington you can expect pleasant maximum average daytime temperatures around 18°C (64°F) and nighttime temperatures around 14°C (57°F).
Find more detailed climate information for Wellington in March here.
Perfect weather is subjective. On this map perfect weather has been defined with temperatures between 20°C (68°F) and 29°C (84°F) and not too much precipitation (less than 90 mm (3.5 in) a month).
In April the weather in Wellington ranges from mixed in Paraparaumu Beach to good in Wellington. In Wellington you can expect mild maximum average daytime temperatures around 17°C (63°F) and nighttime temperatures around 13°C (55°F).
Find more detailed climate information for Wellington in April here.
Perfect weather is subjective. On this map perfect weather has been defined with temperatures between 20°C (68°F) and 29°C (84°F) and not too much precipitation (less than 90 mm (3.5 in) a month).
In May the weather in Wellington ranges from mixed in Paraparaumu Beach to good in Wellington. In Wellington you can expect mild maximum average daytime temperatures around 15°C (59°F) and nighttime temperatures around 11°C (52°F).
Find more detailed climate information for Wellington in May here.
Perfect weather is subjective. On this map perfect weather has been defined with temperatures between 20°C (68°F) and 29°C (84°F) and not too much precipitation (less than 90 mm (3.5 in) a month).
In June the weather in Wellington ranges from less favorable in Wellington to mixed in Martinborough. In Wellington you can expect mild maximum average daytime temperatures around 13°C (55°F) and nighttime temperatures around 10°C (50°F).
Find more detailed climate information for Wellington in June here.
Perfect weather is subjective. On this map perfect weather has been defined with temperatures between 20°C (68°F) and 29°C (84°F) and not too much precipitation (less than 90 mm (3.5 in) a month).
In July the weather in Wellington ranges from less favorable in Paraparaumu Beach to mixed in Wellington. In Wellington you can expect mild maximum average daytime temperatures around 13°C (55°F) and nighttime temperatures around 9°C (48°F). On average, this month is the coldest month of the year in Wellington.
Find more detailed climate information for Wellington in July here.
Perfect weather is subjective. On this map perfect weather has been defined with temperatures between 20°C (68°F) and 29°C (84°F) and not too much precipitation (less than 90 mm (3.5 in) a month).
In August the weather in Wellington ranges from less favorable in Paraparaumu Beach to mixed in Wellington. In Wellington you can expect mild maximum average daytime temperatures around 13°C (55°F) and nighttime temperatures around 9°C (48°F).
Find more detailed climate information for Wellington in August here.
Perfect weather is subjective. On this map perfect weather has been defined with temperatures between 20°C (68°F) and 29°C (84°F) and not too much precipitation (less than 90 mm (3.5 in) a month).
In September the weather in Wellington ranges from less favorable in Paraparaumu Beach to good in Wellington. In Wellington you can expect mild maximum average daytime temperatures around 14°C (57°F) and nighttime temperatures around 10°C (50°F).
Find more detailed climate information for Wellington in September here.
Perfect weather is subjective. On this map perfect weather has been defined with temperatures between 20°C (68°F) and 29°C (84°F) and not too much precipitation (less than 90 mm (3.5 in) a month).
In October the weather in Wellington ranges from mixed in Lower Hutt to good in Wellington. In Wellington you can expect mild maximum average daytime temperatures around 15°C (59°F) and nighttime temperatures around 11°C (52°F).
Find more detailed climate information for Wellington in October here.
Perfect weather is subjective. On this map perfect weather has been defined with temperatures between 20°C (68°F) and 29°C (84°F) and not too much precipitation (less than 90 mm (3.5 in) a month).
In November the weather in Wellington ranges from mixed in Paraparaumu Beach to good in Wellington. In Wellington you can expect mild maximum average daytime temperatures around 16°C (61°F) and nighttime temperatures around 12°C (54°F).
Find more detailed climate information for Wellington in November here.
Perfect weather is subjective. On this map perfect weather has been defined with temperatures between 20°C (68°F) and 29°C (84°F) and not too much precipitation (less than 90 mm (3.5 in) a month).
In December the weather in Wellington ranges from mixed in Paraparaumu Beach to very good in Lower Hutt. The temperatures range from moderate in Wellington with 17°C (63°F) to pleasant in Masterton with 19°C (66°F).
Find more detailed climate information for Wellington in December here.
Perfect weather is subjective. On this map perfect weather has been defined with temperatures between 20°C (68°F) and 29°C (84°F) and not too much precipitation (less than 90 mm (3.5 in) a month).
More climate information for the top 5 destinations in Wellington:
Need travel inspiration? Check out our bucket list articles and be inspired.
The Tongariro Crossing in New Zealand
It is called the most beautiful walk in New Zealand, the Tongariro Crossing. The official hiking season starts late October until end of April.
 White-water sledge and raft in Rotorua
We recommend to white-water sledge and raft in Rotorua in summer (January, February) when the Glacier melt fills the rivers. This is the best time.
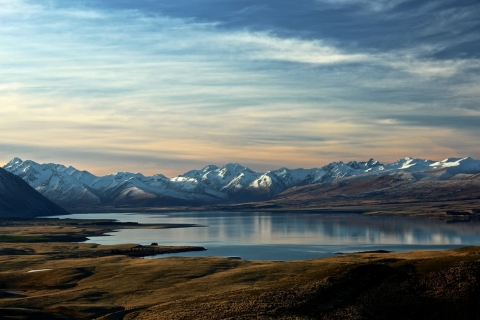 New Zealand in February: North Island or South Island?
Compare New Zealand weather in February for Auckland, Rotorua, Taupo, Christchurch and Queenstown to see which island has the best conditions.