















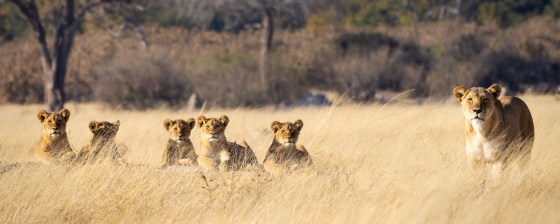
 Hwange National Park: Discover Zimbabwe's untamed wilderness
Discover Zimbabwe's iconic Hwange National Park, a vast wilderness teeming with wildlife. Unforgettable safaris, diverse landscapes, and captivating encounters await.
October in Masvingo sees daytime temperatures around 30°C (86°F) and lows of 16°C (61°F) at night. The excellent weather makes it a good time to visit.
Our weather planner can help you find worldwide destinations with pleasant weather during this period. March, April, May, June, July, August and September typically offer the best weather for Masvingo.
 Min Temperature
Max Temperature
Min Temperature
Max Temperature
 Chance of Rain
Precipitation
Rainy days
Chance of Rain
Precipitation
Rainy days
 Humidity
 Sunshine
Percentage Sunshine
Sunshine
Percentage Sunshine
Pick a month to see the average temperature, rainfall and sunshine in Masvingo - and find the best time to visit.
50-year average (1976-2025)
Based on our historical records, temperatures in Masvingo typically stay consistent throughout October, with daily highs averaging around 30°C (86°F). Nights are pleasant, with lows typically ranging from 14°C (57°F) to 17°C (63°F).
Browse day-by-day weather records for Masvingo spanning 51 years. Select any month and year to see actual temperatures, rainfall, and conditions recorded on each day.
Based on 23 years of weather observations (2002-2025), these are the most extreme conditions recorded in Masvingo.
Find out more about the weather in Zimbabwe and which places have the best travel conditions in this month. See all of Zimbabwe in October →
Perfect weather is subjective. On this map perfect weather has been defined with temperatures between 20°C (68°F) and 29°C (84°F) and not too much precipitation (less than 90 mm (3.5 in) a month).
Warm but pleasant conditions in Masvingo in October. Focus on lightweight, maybe with natural fabrics, cotton blend shirts, comfortable shorts, and breathable footwear. A light cover-up for sun protection is smart too. Light rain is possible, so consider bringing a small umbrella or rain jacket. And with plenty of sunshine hours, don’t forget sunglasses, sunscreen, and maybe a sun hat.
We rated the following activities from 1 (least suitable) to 10 (best) to do.


Temperature Rainfall Sunshine Humidity
See the full Masvingo climate overview or explore weather in Zimbabwe.
Where to go in October - average daytime high across popular destinations.
Dete 35°C (95°F) Chinhoyi32°C (90°F) Kwekwe33°C (91°F) Bulawayo
 31°C (88°F) Gweru30°C (86°F) Harare29°C (84°F) Mutare28°C (82°F) Nyanga26°C (79°F)
 Need travel inspiration? Check out our bucket list articles and be inspired.
Hwange National Park: Discover Zimbabwe's untamed wilderness
Discover Zimbabwe's iconic Hwange National Park, a vast wilderness teeming with wildlife. Unforgettable safaris, diverse landscapes, and captivating encounters await.
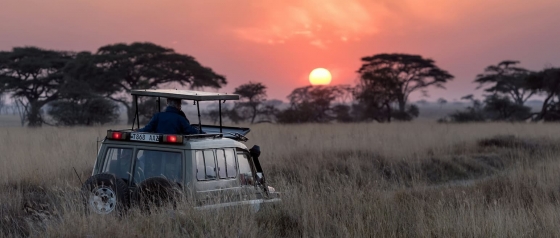
 5 Untouched Safari Destinations in Africa
Discover Africa's hidden national parks, from Zambia's Liuwa Plain to Zimbabwe's Matusadona, offering unique wildlife experiences off the beaten path.
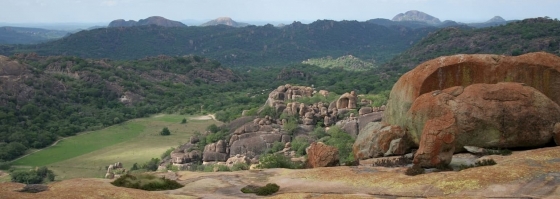 Matobo National Park: A Land of Ancient Wonders
Discover the wonders of Matobo National Park, Zimbabwe—home to stunning granite formations, rich wildlife, and ancient spiritual rock paintings.
 Visit Kruger Park in South Africa
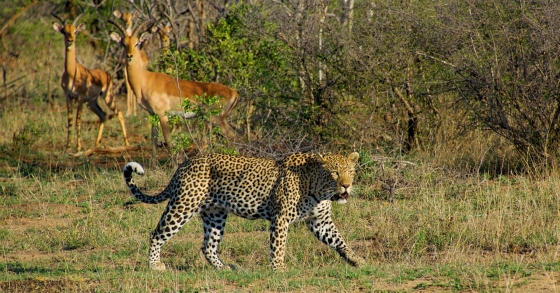
Are you going to South Africa, then you cannot skip the Kruger Park. The Kruger Park is one of the most beautiful and largest safari parks in the world.