
 The 10 most charming villages in France
Discover France's top 10 beautiful villages. From Normandy to the Côte d'Azur, experience quaint squares and cobbled streets. Which one will you visit this summer?
Lower Normandy is a region in France. Many people wonder what the weather conditions are in Lower Normandy over the year. What is the best time to visit Lower Normandy?
This page shows the average weather conditions by month in Lower Normandy over the year in: January, February, March, April, May, June, July, August, September, October, November, December.
In January the weather in Lower Normandy is generally less favorable. January is a winter month. The average maximum daytime temperatures are low and range from 8°C (46°F) in LʼAigle to 10°C (50°F) in Omonville-la-Petite. On average, this month is the coldest month of the year in Lower Normandy.
Find more detailed climate information for Lower Normandy in January here.
Perfect weather is subjective. On this map perfect weather has been defined with temperatures between 20°C (68°F) and 29°C (84°F) and not too much precipitation (less than 90 mm (3.5 in) a month).
In February the weather in Lower Normandy is generally less favorable. February is a winter month. In Honfleur you can expect cold maximum average daytime temperatures around 9°C (48°F) and nighttime temperatures around 3°C (37°F).
Find more detailed climate information for Lower Normandy in February here.
Perfect weather is subjective. On this map perfect weather has been defined with temperatures between 20°C (68°F) and 29°C (84°F) and not too much precipitation (less than 90 mm (3.5 in) a month).
In March the weather in Lower Normandy is generally mixed. The temperatures range from low in Gatteville-le-Phare with 11°C (52°F) to moderate in Sacey with 13°C (55°F).
Find more detailed climate information for Lower Normandy in March here.
Perfect weather is subjective. On this map perfect weather has been defined with temperatures between 20°C (68°F) and 29°C (84°F) and not too much precipitation (less than 90 mm (3.5 in) a month).
In April the weather in Lower Normandy ranges from mixed in Quettehou to good in Honfleur. The average maximum daytime temperatures are moderate and range from 12°C (54°F) in Gatteville-le-Phare to 16°C (61°F) in Saint-Germain-de-la-Coudre.
Find more detailed climate information for Lower Normandy in April here.
Perfect weather is subjective. On this map perfect weather has been defined with temperatures between 20°C (68°F) and 29°C (84°F) and not too much precipitation (less than 90 mm (3.5 in) a month).
In May the weather in Lower Normandy ranges from good in Quettehou to excellent in Saint-Germain-de-la-Coudre. The temperatures range from moderate in Gatteville-le-Phare with 15°C (59°F) to pleasant in Saint-Germain-de-la-Coudre with 20°C (68°F).
Find more detailed climate information for Lower Normandy in May here.
Perfect weather is subjective. On this map perfect weather has been defined with temperatures between 20°C (68°F) and 29°C (84°F) and not too much precipitation (less than 90 mm (3.5 in) a month).
In June the weather in Lower Normandy ranges from good in Réville to excellent in Honfleur. The temperatures range from moderate in Gatteville-le-Phare with 17°C (63°F) to high in Saint-Germain-de-la-Coudre with 23°C (73°F).
Find more detailed climate information for Lower Normandy in June here.
Perfect weather is subjective. On this map perfect weather has been defined with temperatures between 20°C (68°F) and 29°C (84°F) and not too much precipitation (less than 90 mm (3.5 in) a month).
In July the weather in Lower Normandy is generally excellent. July is a summer month. The temperatures range from pleasant in Omonville-la-Petite with 19°C (66°F) to high in Saint-Germain-de-la-Coudre with 25°C (77°F).
Find more detailed climate information for Lower Normandy in July here.
Perfect weather is subjective. On this map perfect weather has been defined with temperatures between 20°C (68°F) and 29°C (84°F) and not too much precipitation (less than 90 mm (3.5 in) a month).
In August the weather in Lower Normandy is generally excellent. August is a summer month. The temperatures range from pleasant in Omonville-la-Petite with 20°C (68°F) to high in Saint-Germain-de-la-Coudre with 25°C (77°F). On average, this month is the warmest month of the year in Lower Normandy.
Find more detailed climate information for Lower Normandy in August here.
Perfect weather is subjective. On this map perfect weather has been defined with temperatures between 20°C (68°F) and 29°C (84°F) and not too much precipitation (less than 90 mm (3.5 in) a month).
In September the weather in Lower Normandy ranges from very good in Quettehou to excellent in Honfleur. September is a summer month. The average maximum daytime temperatures are pleasant and range from 19°C (66°F) in Omonville-la-Petite to 22°C (72°F) in Saint-Germain-de-la-Coudre.
Find more detailed climate information for Lower Normandy in September here.
Perfect weather is subjective. On this map perfect weather has been defined with temperatures between 20°C (68°F) and 29°C (84°F) and not too much precipitation (less than 90 mm (3.5 in) a month).
In October the weather in Lower Normandy ranges from mixed in Quettehou to good in Honfleur. In Honfleur you can expect mild maximum average daytime temperatures around 17°C (63°F) and nighttime temperatures around 10°C (50°F).
Find more detailed climate information for Lower Normandy in October here.
Perfect weather is subjective. On this map perfect weather has been defined with temperatures between 20°C (68°F) and 29°C (84°F) and not too much precipitation (less than 90 mm (3.5 in) a month).
In November the weather in Lower Normandy ranges from less favorable in Quettehou to mixed in Honfleur. The temperatures range from low in LʼAigle with 11°C (52°F) to moderate in Gatteville-le-Phare with 14°C (57°F).
Find more detailed climate information for Lower Normandy in November here.
Perfect weather is subjective. On this map perfect weather has been defined with temperatures between 20°C (68°F) and 29°C (84°F) and not too much precipitation (less than 90 mm (3.5 in) a month).
In December the weather in Lower Normandy is generally less favorable. December is a winter month. The average maximum daytime temperatures are low and range from 8°C (46°F) in LʼAigle to 12°C (54°F) in Omonville-la-Petite.
Find more detailed climate information for Lower Normandy in December here.
Perfect weather is subjective. On this map perfect weather has been defined with temperatures between 20°C (68°F) and 29°C (84°F) and not too much precipitation (less than 90 mm (3.5 in) a month).
More climate information for the top 5 destinations in Lower Normandy:
Need travel inspiration? Check out our bucket list articles and be inspired.
The 10 most charming villages in France
Discover France's top 10 beautiful villages. From Normandy to the Côte d'Azur, experience quaint squares and cobbled streets. Which one will you visit this summer?
 An alternative way to discover Paris
From street art, vintage shops, vegetarian cafes, to amazing cultural events, Paris has much to offer for the creative traveler. An overview of sights that you must see if you want to visit this city in an alternative way.
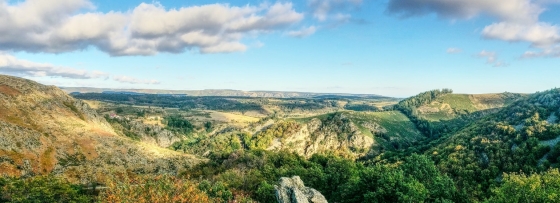 Nature is allowed to take its course in the Ardeche
The Ardèche is France at its most beautiful. The authentic villages and breathtaking mountainous landscapes are one of the main reasons. he climate in Ardèche is very pleasant. Temperatures are high during summer and it is often very sunny.

 Explore the natural wonders of Corsica
Corsica offers an abundance of incredible natural wonders to explore. This stunning Mediterranean island is a paradise for outdoor enthusiasts and nature lovers alike.