Climate ▸Forecast ▸October ▸November ▸
JanuaryFebruaryMarchAprilMayJuneJulyAugustSeptemberOctoberNovemberDecember

October Rainfall Precipitation in Antigua & Barbuda

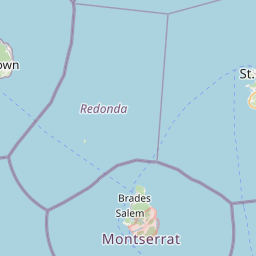
Antigua & Barbuda experiences in October precipitation ranging from a high 141 mm in Jolly Harbour to a high 145 mm in Saint Philips. October typically stands out as the wettest month of the year in Antigua & Barbuda.

Map not visible? Whoops sorry! Please refresh the page.
MarkerMarkerMarkerMarkerMarkerMarkerMarkerMarkerMarker
Legend heavy rainfall high moderate low almost none
Heavy rainfall has been defined as more than 160 mm precipitation. High: 90 mm to 160 mm. Moderate: 30 mm to 90 mm. Low: 5 mm to 30 mm.

Select a Month of Interest

Check the conditions for any month of the year.

For a detailed overview over the year and the best time to visit Antigua & Barbuda, check out our Antigua & Barbuda's climate page.

  • How much rainfall does Antigua & Barbuda receive in October?
  • October in Saint Johnʼs is marked by substantial rain, totaling an average of 142 mm. Rapid weather changes are common due to the frequent precipitation. Based on climate data from the last 30 years, Saint Johnʼs receives the most rainfall during this month of the year.

  • What is the wettest city in October in Antigua & Barbuda?
  • According to our data the wettest location is Saint Philips with an average precipitation of 145 mm.

  • What is the driest city in October in Antigua & Barbuda?
  • The driest place is Jolly Harbour with an average precipitation of 141 mm according to our data.

    Interested in more climate information?

    Weather and climate has detailed information for every country in the world. Are you going to Antigua & Barbuda? Get detailed historical weather averages for many cities in Antigua & Barbuda.

    Not sure yet where to go? We now have a tool which recommends destinations that suit your ideal travel conditions. Find out where to go with our weather planner.