Average monthly water temperature in Port Saplaya, Spain
On this page you find the mean water temperature over the year in Port Saplaya (), Spain. Dive into the water temperature trends, highlighting the best times for swimming and other activities.
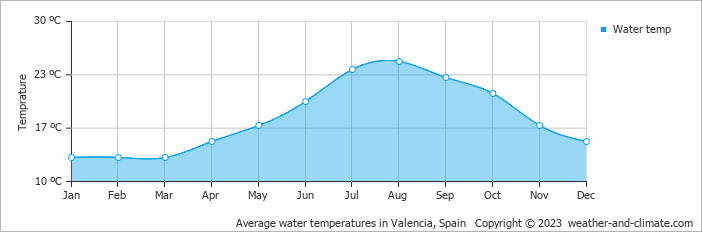
Data from: Valencia, Spain (12 KM, 7 Miles).
In Port Saplaya, the water undergoes seasonal changes. The warmest month is August, with an average water temperature of 25°C (77°F).
The coldest water temperature month, January, has an average temperature of 13°C (55°F). It may not be the ideal time for a swim.