Average monthly water temperature in Murla, Spain
On this page you find the mean water temperature over the year in Murla (Valencia Community), Spain. Dive into the water temperature trends, highlighting the best times for swimming and other activities.
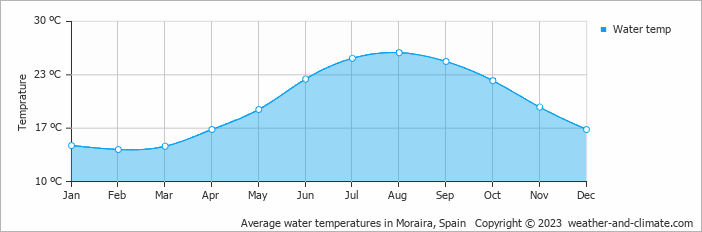
Data from: Moraira, Spain (20 KM, 12 Miles).
In Murla, water temperatures vary throughout the year. The warmest month is August, with an average water temperature of 26°C (79°F).
The coldest month is February, with an average temperature of 14°C (57°F). These seasonal variations make Murla a great destination for different kinds of aquatic activities.