Climate ▸Forecast ▸February ▸March ▸
JanuaryFebruaryMarchAprilMayJuneJulyAugustSeptemberOctoberNovemberDecember

Average water temperature in Kjalarnes

On this page you find the mean water temperature over the year in Kjalarnes (), Iceland. Take a closer look at the water temperature patterns and what they mean for swimming and recreation.

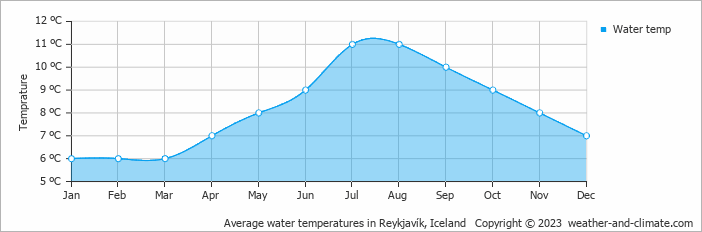
Data from: Reykjavík, Iceland (12 KM, 7 Miles).

Water temperatures in Kjalarnes stay on the cooler side throughout the year. The warmest month, August, averages 11°C.

The coldest water temperature month is March, averaging 6°C. These cooler conditions are not the best for swimming enthusiasts.


Forecast for Kjalarnes

Wednesday
19 Feb
Rain
Rain
6°C
11 mm
Thursday
20 Feb
Rain
Rain
5°C
3.1 mm
Friday
21 Feb
Light rain
Light rain
5°C
2.8 mm

Interested in more climate information?

This site provides you with all the information you need about the climate in Kjalarnes.

Our site offers climate and forecast data for every country in the world. Are you going to Iceland? On this website you can find historical weather averages for many cities in Iceland. Not sure yet where to go? We now have a tool which recommends destinations that suit your ideal travel conditions. Find out where to go with our weather planner.

) ?>