Climate ▸Forecast ▸February ▸March ▸
JanuaryFebruaryMarchAprilMayJuneJulyAugustSeptemberOctoberNovemberDecember

Average water temperature in Carnarvon

On this page you find the mean water temperature over the year in Carnarvon (Australian Capital Territory), Australia. Get insights into the water temperature fluctuations and discover what they mean for visitors.

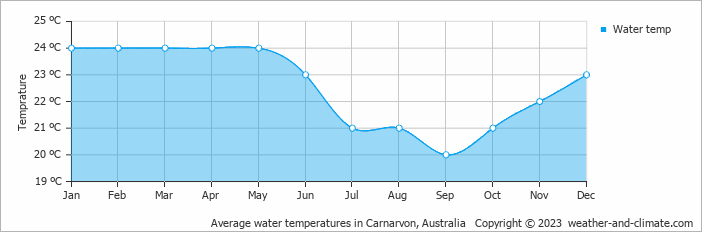
In Carnarvon, water temperatures vary throughout the year. The warmest month is May, with an average water temperature of 24°C.

The coldest month is September, with an average temperature of 20°C. These seasonal variations make Carnarvon a great destination for different kinds of aquatic activities.


Forecast for Carnarvon

Tuesday
18 Feb
Clear sky
Clear sky
32°C
0 mm
Wednesday
19 Feb
Clear sky
Clear sky
31°C
0 mm
Thursday
20 Feb
Partly cloudy
Partly cloudy
32°C
0 mm

Interested in more climate information?

This site provides you with all the information you need about the climate in Carnarvon.

Our site offers climate and forecast data for every country in the world. Are you going to Australia? On this website you can find historical weather averages for many cities in Australia. Not sure yet where to go? We now have a tool which recommends destinations that suit your ideal travel conditions. Find out where to go with our weather planner.

) ?>