Average monthly water temperature in Barra da Tijuca Beach, Brazil
On this page you find the mean water temperature over the year in Barra da Tijuca Beach (Rio de Janeiro State), Brazil. Dive into the water temperature trends, highlighting the best times for swimming and other activities.
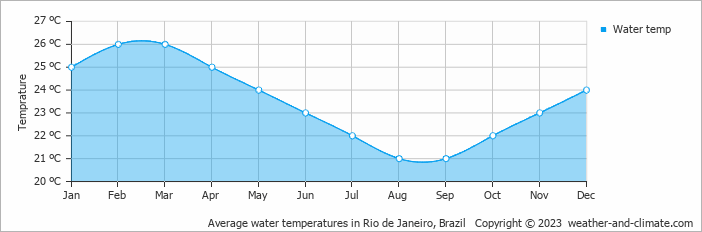
Data from: Rio de Janeiro, Brazil (19 KM, 11 Miles).
In Barra da Tijuca Beach, water remains inviting throughout the year. The warmest month is February, with an average water temperature of 26°C (79°F).
The coolest temperature, August, still averages a pleasant 21°C (70°F). This means you will have a consistently enjoyable environment for water activities and recreation.