Average monthly snow and rainfall in Talavera de la Reina
The mean monthly precipitation over the year in Talavera de la Reina (Castilla-La Mancha), including rain, snow, hail.
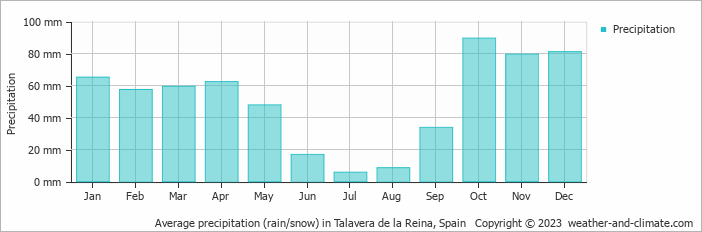
- Talavera de la Reina has dry periods in June, July and August.
- On average, October is the wettest month with 90 mm of precipitation.
- On average, July is the driest month with 6 mm of precipitation.
- The average amount of annual precipitation is 607 mm.
Weather Forecasts for Talavera de la Reina
Fri Apr 26
18°C | 8°C
W  14 km/h
14 km/hbroken clouds and no rain
Sat Apr 27
17°C | 8°C
W 18 km/h
18 km/h3.9 mm
partly cloudy and rain
Sun Apr 28
19°C | 5°C
W 11 km/h
11 km/halmost clear and no rain


