Average monthly snow and rainfall in Table View
The mean monthly precipitation over the year in Table View (Western Cape), including rain, snow, hail.
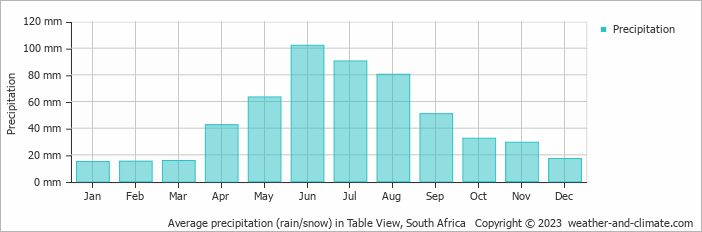
- Most rainfall (rainy season) is seen in June.
- Table View has dry periods in January, February, March and December.
- On average, June is the wettest month with 102 mm of precipitation.
- On average, January is the driest month with 15 mm of precipitation.
- The average amount of annual precipitation is 553 mm.
Weather Forecasts for Table View
Fri Apr 26
29°C | 15°C
S  29 km/h
29 km/hclear and no rain
Sat Apr 27
33°C | 15°C
SE 14 km/h
14 km/hpartly cloudy and no rain
Sun Apr 28
25°C | 15°C
NW 22 km/h
22 km/hclear and no rain


