Ryfoss Precipitation: Average Monthly Rainfall and Snowfall
This graph shows the average amount of rainfall per month in Ryfoss (Oppland). The numbers are calculated over a 30-year period to provide a reliable average.
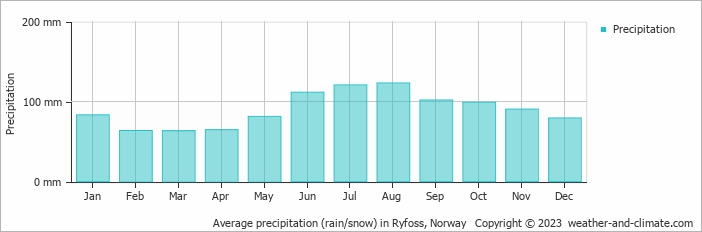
- A lot of rain (rainy season) falls in the months: June, July, August and September.
- On average, August is the wettest month with 123 mm of precipitation.
- On average, March is the driest month with 63 mm of precipitation.
- The average amount of annual precipitation is 1080 mm.
Current rainfall in Ryfoss
Thu Nov 28
1°C | -11°C
W  4 km/h
4 km/halmost clear and no rain
Fri Nov 29
0°C | -10°C
W 4 km/h
4 km/h4.5 mm
overcast and snow
Sat Nov 30
4°C | 0°C
N 4 km/h
4 km/h1.2 mm
overcast and slight sleet