Average monthly snow and rainfall in Playa Migjorn
The mean monthly precipitation over the year in Playa Migjorn (Balearic Islands), including rain, snow, hail.
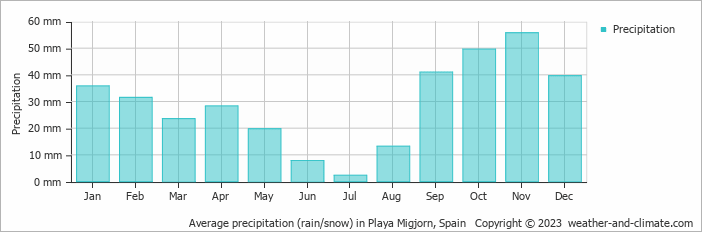
- Playa Migjorn has dry periods in March, May, June, July and August.
- On average, November is the wettest month with 56 mm of precipitation.
- On average, July is the driest month with 2 mm of precipitation.
- The average amount of annual precipitation is 348 mm.
Weather Forecasts for Playa Migjorn
Fri Apr 26
20°C | 14°C
SE  22 km/h
22 km/hpartly cloudy and no rain
Sat Apr 27
20°C | 17°C
SW 43 km/h
43 km/h1.4 mm
broken clouds and small chance of slight rain
Sun Apr 28
18°C | 15°C
S 29 km/h
29 km/h11 mm
broken clouds and rain


