Oklahoma City (OK) Precipitation: Average Monthly Rainfall and Snowfall
This graph shows the average amount of rainfall per month in Oklahoma City (Oklahoma). The numbers are calculated over a 30-year period to provide a reliable average.
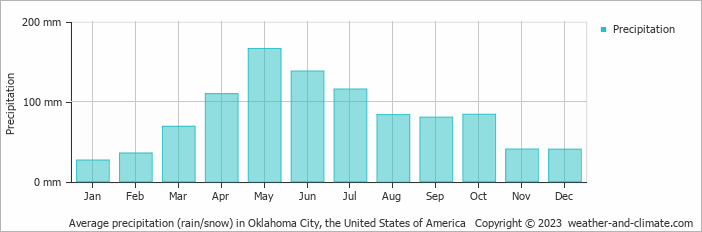
- A lot of rain (rainy season) falls in the months: April, May, June and July.
- On average, May is the wettest month with 166 mm of precipitation.
- On average, January is the driest month with 27 mm of precipitation.
- The average amount of annual precipitation is 988 mm.
Current rainfall in Oklahoma City (OK)
Mon Nov 18
21°C | 9°C
SW  43 km/h
43 km/h28 mm
partly cloudy and thunder
Tue Nov 19
18°C | 6°C
N 14 km/h
14 km/hclear and no rain
Wed Nov 20
14°C | 3°C
NW 22 km/h
22 km/hclear and no rain


