Average monthly snow and rainfall in Las Tunas
The mean monthly precipitation over the year in Las Tunas (), including rain, snow, hail.
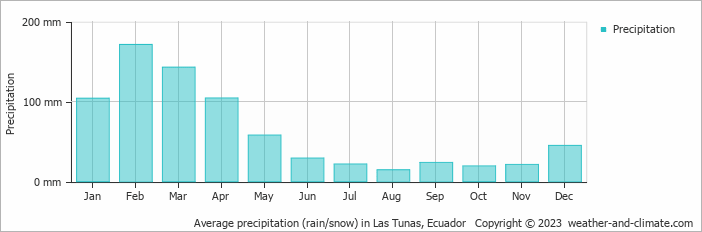
- A lot of rain (rainy season) falls in the months: January, February, March and April.
- Las Tunas has dry periods in July, August, September, October and November.
- On average, February is the wettest month with 171 mm of precipitation.
- On average, August is the driest month with 14 mm of precipitation.
- The average amount of annual precipitation is 754 mm.
Weather Forecasts for Las Tunas
Thu Apr 25
32°C | 23°C
W  14 km/h
14 km/hpartly cloudy and no rain
Fri Apr 26
29°C | 23°C
SW 11 km/h
11 km/h0.4 mm
partly cloudy and slight rain
Sat Apr 27
32°C | 23°C
W 11 km/h
11 km/hpartly cloudy and no rain