Average monthly snow and rainfall in Gold Coast
The mean monthly precipitation over the year in Gold Coast (Queensland), including rain, snow, hail.
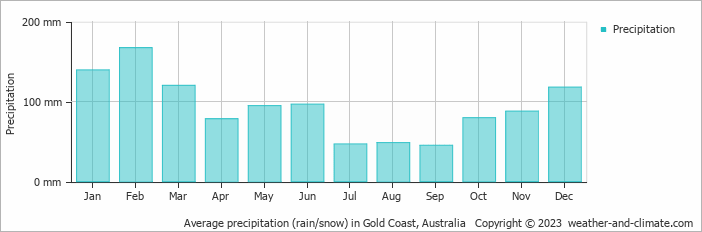
- A lot of rain (rainy season) falls in the months: January, February, March and December.
- On average, February is the wettest month with 167 mm of precipitation.
- On average, September is the driest month with 45 mm of precipitation.
- The average amount of annual precipitation is 1121 mm.
Forecast for Gold Coast
Wed May 08
23°C | 16°C
SE  29 km/h
29 km/h0.5 mm
partly cloudy and slight rain
Thu May 09
22°C | 17°C
S 22 km/h
22 km/h2.9 mm
broken clouds and rain
Fri May 10
22°C | 16°C
SE 25 km/h
25 km/h0.8 mm
partly cloudy and slight rain


